

Table of Contents

ECO-201 – Principles of Microeconomics: Understanding Markets, Consumer Behavior, and Economic Decision-Making
Published: 2025-10-08
Modified: 2025-10-08
Samples Solutions
- ECO 201 1-2 Discussion: Solution
- ECO 201 2-2 Solution
- ECO 201 3-2 Simulation Discussion: Competitive Markets
- ECO 201 4-2 Simulation Checkpoint: Assignment
- ECO 201 5-2 Simulation Discussion: Production Entry and Exit
- ECO 201 6-2 Simulation Discussion: Monopolies and Monopolistic Competition
- ECO 201 7 Solution
- ECO 201 8-1 Project Submission
- ECO 201 8-2 Solution
Introduction
ECO-201 – Principles of Microeconomics introduces students to how individuals and firms make decisions in competitive and noncompetitive markets. The course explores key economic principles, including supply and demand, production, pricing, and market equilibrium. For help with simulation discussions or project submissions, visit Owlisdom’s Economics Essay Writing Service for expert academic support.
ECO 201 1-2 Discussion: Economics and Business Decisions
Instructions for ECO 201 1-2 Discussion
1-2 Discussion: Economics and Business Decisions
Every individual confronts economic issues daily. This is especially true of business owners, who spend their time thinking of economic issues such as how to handle changes in the price of goods, how to allocate their time, and whether to buy or produce goods in order to efficiently allocate their scarce resources.
In your initial post, begin by introducing yourself briefly, including your program of study and career interests. Then, address the following as part of your response:
- Imagine you own your own business and have to make daily decisions about how to allocate available resources, such as input of production, time, purchasing decisions, and so forth. What role do you think microeconomics has in running a business?
- Which of the principles of economics outlined in your reading would you be more likely to apply when making business decisions? Provide at least two to three examples.
In your responses to your peers, comment on at least two posts that discuss a different economic principle than the one you chose. Draw connections between the different principles and the role of microeconomics in everyday life.
To complete this assignment, review the Module One Discussion Rubric
Introduction to ECO 201 1-1 Discussion
Welcome to the ECO 201 1-2 Discussion post. This first discussion post revolves around your understanding of economics in business decisions. I will provide brief and descriptive guidelines to solve this ECO 201 1-2 Discussion: Economics and Business Decisions post and a dummy solution for each section. This Owlisdom How-To Guide will equip you with guidelines to tackle all the queries related to the 1-2 Discussion post. Let us begin with the guide.
Introduce yourself briefly, including your program of study and career interests.
About You
We will start the ECO 201 1-2 Discussion: Economics and Business Decisions by briefly introducing ourselves.
- Write a brief personal introduction: Mention your field of study and any specific interests in economics or business. Highlight why understanding economics is crucial for anyone in the business field.
- Discuss the role of microeconomics: Explain how microeconomics helps in making informed business decisions, such as pricing strategies, resource allocation, and understanding market dynamics.
Example
Hey everyone, I am currently studying Economics and Business Decisions. I have always been fascinated by how businesses make crucial decisions, from setting prices to allocating resources efficiently. Understanding economics, especially microeconomics, is critical in this field. It dives deep into market dynamics, consumer behavior, and how supply and demand influence decision-making processes. We can make informed choices that steer our businesses toward success in competitive markets by grasping these concepts.
Imagine you own your own business and have to make daily decisions about allocating available resources, such as production input, time, purchasing decisions, etc. What role do you think microeconomics has in running a business?
Understanding Resource Allocation
This section of ECO 201 1-2 Discussion: Economics and Business Decisions will discuss our understanding of resource allocation.
- Learn Core Microeconomic Concepts: Grasp fundamental principles like supply and demand, opportunity cost, and marginal analysis. Understand how these influence pricing, production, and resource allocation decisions in a business setting.
- Apply Principles to Decision-Making: Use opportunity cost to weigh different resource allocation options and marginal analysis for efficient production and investment decisions. This helps optimize resource use and maximize profits.
- Adapt Strategies Based on Market Dynamics: Incorporate supply and demand insights to adjust pricing strategies and product offerings. Analyze market trends and consumer behavior to stay competitive and meet customer needs effectively.
Example
In the day-to-day running of a business, microeconomics is like a guiding light. It is not just about numbers but about understanding the behavior behind those numbers. For instance, knowing supply and demand helps us set the correct prices and decide how much to produce. But it goes deeper—opportunity cost makes us think about what we are giving up with every decision, ensuring we always choose the most valuable option. Let us not forget marginal analysis; figuring out how much extra input is worth for the output we get is crucial to help avoid the wastage of resources. Plus, by keeping an eye on market dynamics, we can pivot our strategies timely to stay ahead or meet our customers right where their needs are. It is fascinating how microeconomics applies to practically every decision we make in our business.
Which of the principles of economics outlined in your reading would you be more likely to apply when making business decisions? Provide at least two to three examples.
Applying Economic Principles to Business Decisions
Next, in ECO 201 1-2 Discussion: Economics and Business Decisions. We will discuss applying economic principles to our business decisions.
- Apply the Principle of Opportunity Cost: Provide examples of evaluating what is being given up when deciding and why it is essential for making efficient choices.
- Utilize the Marginal Principle: Describe how to compare an action’s additional benefits to its costs for better decision-making.
- Incorporate the Principle of Voluntary Exchange: Explain the importance of engaging in mutually beneficial transactions and how this can lead to better business outcomes.
Example
I would lean heavily on the Opportunity Cost and the Marginal Principle. For example, when deciding whether to invest in new technology, I would consider what we are potentially sacrificing, like immediate cash flow or other investments. It is about weighing the benefits of what you are getting against what you are giving up. With the Marginal Principle, if we consider increasing our production, we would consider whether the cost of producing one more unit is outweighed by the revenue it would bring. It is crucial to ensure we do not overextend resources for diminishing returns. The Principle of Voluntary Exchange is about creating win-win situations, like negotiating supplier contracts that benefit both sides and enhancing long-term business relationships.
Discuss a different economic principle than the one you chose. Draw connections between the different principles and the role of microeconomics in everyday life.
Peer Responses
Responding to peers in a vital section of the ECO 201 1-2 Discussion: Economics and Business Decisions
- Connect different economic principles: Offer insights on how different principles discussed by peers are interconnected and their relevance to everyday business decisions.
- Highlight the role of microeconomics: Briefly discuss how the principle highlighted by a peer plays into broader economic decision-making and everyday life.
Response 01
Hey Alex, great post! I appreciated your insights on using economic principles like opportunity cost in business decisions. Another interesting concept is the Law of Diminishing Returns, which ties closely with marginal analysis. It shows that increasing production factors can reduce per-unit returns, emphasizing the practical use of microeconomics in optimizing production levels and resource management in everyday business operations. Your examples really highlight how crucial these principles are in strategic planning.
Response 02
I have addressed the given instructions in one response. Following these instructions, you can quickly write your peer responses to 1-2 Discussions without a hassle.
Closing
This How-To Guide aims to provide brief and detailed guidelines to students of ECO 201 on how to solve the ECO 201 1-2 Discussion: Economics and Business Decisions. Hope this guide helps you ace your discussion post. Good luck!
You can also read our ECO 201 next module 2-2 Simulation Discussion: Comparative Advantage.
ECO 201 2-2 Simulation Discussion: Comparative Advantage
Instructions for ECO 201 2-2 Simulation Discussion
DISCUSSION
A difference in opportunity costs between businesses can lead to a comparative advantage in the production of a good and the decision to trade.
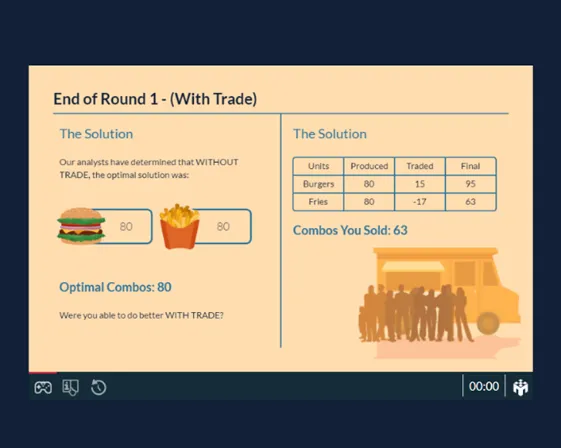
For this discussion, first, play the simulation games Comparative Advantage (Without Trade) and Comparative Advantage (With Trade) in the MindTap environment. Then, you will share your experiences playing the games. Your work in this discussion will directly support your success on the course project.
In your initial post, include the image of your simulation report in your response. See the How to Submit a Simulation Report Image PDF document for more information. Then, address the following questions:
- Imagine you own your own business. How would you evaluate opportunity costs and comparative advantage when making business decisions?
- Look up a Production Possibilities Frontier (PPF) graph. What role does the production possibility frontier (PPF) model have in making business decisions regarding specialization and trade?
In your responses, comment on the posts of at least two peers whose simulations had different outcomes than your own. Research and provide examples of companies in the news that are relevant to your peers’ comments on the value of comparative advantage for making their business decisions.
To access your simulations, click the simulation link found in the module.
To complete this assignment, review the Module Two Simulation Discussion Rubric.
Introduction to ECO 201 2-2 Discussion
The ECO 201 Discussion centres around the concept of comparative advantage and opportunity cost in microeconomics, using interactive simulation games to illustrate these principles. By following this Owlisdom How-To Guide, you will gain a practical understanding of how businesses can use economic theories to make informed decisions about production and trade. ECO 201 2-2 Simulation Discussion: Comparative Advantage includes analysing business scenarios, reflecting on game outcomes, and applying theoretical knowledge to real-world business situations.
For this discussion, first, play the simulation games Comparative Advantage (Without Trade) and Comparative Advantage (With Trade) in the MindTap environment.
Participation in Simulation Games
Playing the Simulation Game: Comparative Advantage (Without Trade)
We must first play the simulation game without trade to start the ECO 201 2-2 Simulation Discussion: Comparative Advantage.
- Understand how individual production choices impact overall productivity without the benefits of trade.
- Engage with the simulation by making different production decisions and observing the productivity and resource allocation outcomes.
Playing the Simulation Game: Comparative Advantage (With Trade)
Next, in ECO 201 2-2 Simulation Discussion: Comparative Advantage. We will play the simulation with trade.
- Learn how trading can enhance productivity and efficiency for businesses.
- Participate in the simulation by implementing trade strategies and note the improvements in outcomes compared to the non-trade scenario.

Imagine you own your own business. How would you evaluate opportunity costs and comparative advantage when making business decisions? Look up a Production Possibilities Frontier (PPF) graph. What role does the production possibility frontier (PPF) model have in making business decisions regarding specialisation and trade?
Understanding the Production Possibilities Frontier (PPF)
In this section of ECO 201 2-2 Simulation Discussion: Comparative Advantage, we will discuss our understanding of the Production Possibilities Frontier by applying it to our business.
- Look up and include a basic PPF graph in your post. Describe its significance in demonstrating the two products’ trade-offs and potential maximum output.
- Using the PPF, discuss how a business can determine which product or service provides a comparative advantage, guiding decisions on specialisation and maximising efficiency.
Example
In accordance with the concept of comparative advantage, one should concentrate efforts in areas where they will yield the most significant impact (Learn Economics, 2022). We mean this by our capacity to produce something more quickly than others. It denotes the capacity to deliver an item using a reduced amount of resources. Consider that we are in the process of deciding what to make for dinner. You are a skilled chef, while I am not. You possess a greater capacity for preparing an exceptionally refined steak than I do. The term for this is “comparative advantage.”
The production possibility frontier (PPF) is a graphical representation that illustrates the potential quantities of two products whose manufacturing processes share a restricted resource (Bloomenthal, 2022). Furthermore, PPF plays a critical role within the field of economics. It could indicate, for instance, that the economy of a nation has achieved its highest level of efficiency possible. Economists and businesses utilise the PPF to imagine potential production scenarios through the modification of a number of resource factors. Companies may employ the PPF to ascertain the impact of various factors on production or to determine which products to develop. By utilising it, economists can assess economic growth and efficiency by selecting the quantity of one product a country can produce without producing another.
In your responses, comment on the posts of at least two peers whose simulations had different outcomes than your own. Research and provide examples of companies in the news relevant to your peers’ comments on the value of comparative advantage for making their business decisions.
Peer Responses
Responding to peers is one of the vital parts of the ECO 201 2-2 Simulation Discussion: Comparative Advantage. We need to provide at least two peer responses. I will provide one example post. You can write your peer responses by keeping the following points in mind.
- Review at least two peer posts with different simulation outcomes. Provide constructive feedback and compare their results with your own, emphasising different strategic choices.
- Research and provide real-world examples of businesses that illustrate the principles discussed in your peers’ posts. Use recent news articles or case studies to support your examples.
Response 01
Excellent Post! The curve of production possibilities is an economic instrument utilised to ascertain the utmost output that can be accomplished with a specified quantity of inputs for both goods. The information consists of any possible amalgamation of the following four production factors: enterprise, labour, capital, products, and natural resources (Bloomenthal, 2022). An economic instrument, a production possibilities curve, illustrates the most efficient method of producing a specified pair of objects. An adjustment in resource allocation results in a proportional change in the total number of each product at each data point along the curve, as more of one good is produced and less of another. Consider an imaginary economy in which 20,000 citrus and 120,000 pears are produced.
Closing
In conclusion, this ECO 201 2-2 Simulation Discussion: Comparative Advantage enhances your understanding of comparative advantage and opportunity costs through interactive simulations and helps develop the ability to apply economic theories to practical business decisions. The ability to analyse and implement these concepts can lead to more strategic decision-making in real-world scenarios, leveraging economic efficiency and growth opportunities.
You can also read our ECO 201 next module 3-2 Simulation Discussion: Competitive Markets.
References
Bloomenthal, A. (2022, August 17). Production Possibility Frontier (PPF): Purpose and Use in Economics. Investopedia. https://www.investopedia.com/terms/p/productionpossibilityfrontier.asp
Fernando, J. (2022, June 27). Opportunity Cost Formula, Calculation, and What It Can Tell You. Investopedia. https://www.investopedia.com/terms/o/opportunitycost.asp
Learn Economics: The Law of Comparative Advantage – 2022. (2022, October 13). MasterClass. https://www.masterclass.com/articles/learn-economics-the-law-of-comparative-advantage
ECO 201 3-2 Simulation Discussion: Competitive Markets
Instructions for ECO 201 3-2 Simulation Discussion
DISCUSSION
Prices are the driving force behind every buying and selling decision in a market economy. Prices are determined by the supply and demand equilibrium and are influenced by the price elasticity of demand and supply of goods and services.
For this discussion, first, play the simulation game Competitive Markets in the MindTap environment. Then, you will share your experiences playing that game. Your work in this discussion will directly support your success on the course project.
In your initial post, include the image of your simulation report in your response. See the How to Submit a Simulation Report Image PDF document for more information. Then, address the following questions:
- Based on the outcome of the simulation, was the sale price you set the same as the equilibrium price? Refer to the supply and demand model to explain why they might be different.
- Imagine that you own your own business. How would price elasticity of demand impact the pricing decisions of your business?
- What are the determinants of price elasticity of demand? Identify at least three examples.
In your responses, comment on at least two posts from your peers and share an example of a company that experienced a change in revenue as the result of a change in the price of the good or service they provided. After reading your peers’ posts, explain which determinants of price elasticity of demand could be the cause of the change in demand.
To access your simulations, click the simulation link found in the module.
To complete this assignment, review the Module Three Simulation Discussion Rubric.
Introduction to ECO 201 3-2 Discussion
This Owlisdom How-To Guide is designed to help you navigate and complete the ECO 201 3-2 Simulation Discussion: Competitive Markets. This simulation provides a practical exploration of how prices are determined in a market economy, focusing on the interplay of supply, demand, and price elasticity. You will simulate running a business, set prices, and then analyse market equilibrium and business strategy outcomes.
Setting Up the Simulation
To start the ECO 201 3-2 Simulation Discussion: Competitive Markets, we need first to play the simulation on MindTap.
- Accessing the Simulation: Log in to the MindTap environment using your student credentials. Locate the Competitive Markets simulation in the course content section.
- Understanding Basic Controls and Features: Familiarize yourself with the simulation interface. Identify controls for setting prices, adjusting supply, and other relevant parameters that affect the market outcome.

Based on the outcome of the simulation, was the sale price you set the same as the equilibrium price? Refer to the supply and demand model to explain their differences.
Analysing the Simulation Outcome
Next, in ECO 201 3-2 Simulation Discussion: Competitive Markets. We will analyse the results of the simulation.
- Comparing Sale Price and Equilibrium Price: Observe the price you set in the simulation and compare it with the equilibrium price that emerges. Document these findings.
- Explaining Differences Using Supply and Demand Model: Use the supply and demand model to analyse why your price may differ from the market equilibrium. Consider factors like production costs and desired profit margins.
Example
The selling price did not coincide with the market equilibrium price. The retail price is calculated by determining the total cost of production and then adding any desired profit margin (Mankiw, 2021). The price at which equilibrium is reached indicates where you ought to be to meet the requirements of the market. Dropping below the equilibrium point causes a scarcity of resources. When you get beyond the end of equilibrium, you will start to accumulate a surplus.
Imagine that you own your own business. How would price elasticity of demand impact your business’s pricing decisions?
Applying Price Elasticity of Demand to Business Decisions
For this section of ECO 201 3-2 Simulation Discussion: Competitive Markets, we will apply the principles of price elasticity of demand in our business decisions.
- Understanding Price Elasticity of Demand: Recognize how sensitive the demand for a product is to price changes.
- Influences on Pricing Decisions: Reflect on how understanding elasticity can inform your pricing strategies to maximise profits or market share.
Example
The price elasticity of demand significantly influences the price decisions made by any company. High price increases can reduce the willingness of customers to purchase the products (James, 2022). If you bring the price down, there will be a greater demand. People tend to give more consideration to a purchase than is necessary if the cost of the goods is high.
What are the determinants of price elasticity of demand? Identify at least three examples
Determinants of Price Elasticity of Demand
Next, in ECO 201 3-2 Simulation Discussion: Competitive Markets, we will discuss the Drivers of Price Elasticity in Demand.
- Time and Price Changes: Discuss how the shifting in elasticity of demand occurs with the time customers are given to modify price changes.
- Availability of Substitutes: Explore how the presence of substitute products can affect the elasticity.
- Necessity vs. Luxury: Determine how a reasonable (necessity or luxury) classification impacts its price elasticity.
Time Elapsed Since a Change In Price
If you look at the influence of a price rise over a more extended period, such as one year, rather than over a shorter period, such as three days, you will find that the price elasticity of demand is more substantial (Corporate Finance Institute, 2022). People have more time to readjust their spending habits when the price adjustment is spread over a longer period.
Availability of Substitutes
When a business deals with items that have near alternatives, such goods are said to have a high degree of price elasticity. This may result in a price increase or a drop in the required good, and consumers may switch to alternatives (Corporate Finance Institute, 2022). If a product has no near options, then the price elasticity of demand for that product is inelastic, which means that an increase in the price will not impact the desired amount.
If The Good Is a Necessity or a Luxury
Inelastic demand exists for goods that are required for life and have a price elasticity of less than one order (Corporate Finance Institute, 2022). If a specific product or service is regarded as a luxury item, then the price elasticity for demand is greater than 1, indicating that its demand is exceptionally elastic.
In your responses, comment on at least two posts from your peers and share an example of a company that experienced a change in revenue due to a change in the price of the good or service they provided. After reading your peers’ posts, explain which determinants of price elasticity of demand could cause the change in demand.
Peer Responses
Responding to peers is one of the vital parts of the ECO 201 3-2 Simulation Discussion: Competitive Markets. We need to provide at least two peer responses. I will provide one example post. You can write your peer responses by keeping the below points in mind.
- Reviewing and Commenting on Peers’ Posts: Engage with at least two peers. Analyse their experiences and outcomes in the simulation.
- Sharing Relevant Business Examples: Provide examples of companies that experienced revenue changes due to pricing adjustments and discuss the potential causes based on elasticity determinants.
Response 01:
The substitution effect pertains to the decrease in sales of goods that can be attributed to consumers choosing less expensive substitutes in response to an increase in the price of the original product. Several factors might cause a product to lose market share, but the substitution impact is an independent manifestation of thrifty behaviour (Boyle, 2022). Some customers may look for cheaper alternatives when a company increases its prices. Many people will switch to eating more chicken if there is an increase in the cost of beef.
Closing
The ECO 201 3-2 Simulation Discussion: Competitive Markets offers a hands-on approach to understanding fundamental economic principles that influence business decisions in real-world markets. By engaging with the simulation and reflecting on your and your peers’ experiences, you gain deeper insights into how market forces interact and how businesses can strategically respond to these dynamics. The discussion and application of price elasticity are precious for making informed pricing decisions in any business context.
You can also read our ECO 201 next module 4-2 Simulation Checkpoint Assignment.
References
Elasticity. (2022, May 7). https://corporatefinanceinstitute.com/resources/economics/elasticity/
James, M. (2022, August 30). Price Elasticity of Demand: Meaning, Types, and Factors That Impact It. Investopedia. https://www.investopedia.com/terms/p/priceelasticity.asp
Mankiw, N. G. (2021). Principles of Economics (9th edition). Cengage Learning, Inc.
ECO 201 4-2 Simulation Checkpoint Assignment
Instructions of ECO 201 4-2 Simulation Checkpoint Assignment
Overview
This simulation checkpoint assignment directly supports your success on the course project. You will play the simulation games, create the image file of your simulation report, and discuss learned concepts and experiences in your submission.
Directions
For this assignment, first, play the simulation games Externalities Without Policy Interventions and Externalities With Policy Interventions in the MindTap environment. Then you will report your experiences playing those games. Your work in this assignment will directly support your success on the course project.
In your submission, remember to include the images of your simulation reports. See the How to Submit a Simulation Report Image document for more information. Then, reflect on the decisions you made in the simulation and address the following government intervention options in your submission:
- Government Tools: Discuss tools available to the government to correct a market failure. Provide examples from the textbook.
- Supply and Demand Equilibrium: Describe how government intervention affects the supply and demand equilibrium. Refer to the simulation game to explain your responses.
- Consumer or Producer Surplus: Specify which government interventions cause a consumer or producer surplus. Explain how they impact consumers or produce a surplus. Provide examples from the textbook.
Guidelines for Submission
Submit your assignment as a Word document. Use Section 2 of the Final Project Template.
Introduction to ECO 201 4-2 Simulation
This Owlisdom How-To Guide will teach you how to analyze competitive markets and externalities based on the instructions provided. Following these guidelines can solve the ECO 201 4-2 Simulation Checkpoint Assignment. This guide will help you understand the government tools used to correct market failures, comprehend the impact of government intervention on supply and demand equilibrium, and identify the effects of government actions on consumer and producer surplus.
NOTE: Remember to add pictures of your simulation reports in your submission and reflect on your decisions to support your analysis.
Play the Simulation Game

Discuss tools available to the government to correct a market failure. Provide examples from the textbook.
Understanding Government Tools
To solve the ECO 201 4-2 Simulation Checkpoint Assignment, we will first play the Simulation game and then discuss the government tools.
- Play the simulation games “Externalities Without Policy Interventions” and “Externalities With Policy Interventions” in the MindTap environment.
- Familiarize yourself with the concepts of Command and Control (CAC) policies and market-based policies.
- Provide examples of each type of government tool from the textbook.
Example
Government intervention can take the form of Command and Control (CAC) or market-based policies when an externality induces market failure and ineffective resource allocation. As stated by Mankiw (2021). Contrarily, CAC policies deal with behavior directly, while market-based policies encourage private decision-makers to handle the issue on their own. The objective of CAC strategies may vary depending on the externality in question, aiming to either incentivize or discourage specific behaviors. A CAC approach, wherein the Environmental Protection Agency imposes restrictions on enterprises’ emissions of contaminants into the atmosphere, could potentially be adopted by the government. As a consequence of this regulation, organizations are obligated to comport themselves in accordance with particular standards. Remedial taxes and subsidies, as well as the exchange of pollution permits, are examples of market-based policies. Carlin & Bowles (2020). Corrective taxes are one approach that may be used to guarantee that private leaders are conscious of society’s costs, which they have to take into consideration in combination with the adverse externality. This can be accomplished through the utilization of corrective taxes. An example that exemplifies this concept is the ability of the Environmental Protection Agency to levy charges on businesses proportional to the amount of pollution they generate. The ability of businesses to purchase and sell pollution licenses gives pollutants leverage in the international struggle against pollution. If an organization’s annual emission falls short of the maximum allowable quantity of 500 tons of pollution as determined by the Environmental Protection Agency, it may engage in negotiations with another company to repurchase the remaining 200 tons of dispersed pollution. Both companies benefit from the agreement, which also ensures adherence to the predetermined emission level mandated by the Environmental Protection Agency.
Describe how government intervention affects the supply and demand equilibrium. Refer to the simulation game to explain your responses.
Analyzing Demand and Supply Equilibrium:
The next section of ECO 201 4-2 Simulation Checkpoint Assignment will discuss how government interventions affect supply and demand.
- Reflect on your decisions regarding government intervention in the simulation games.
- Understand the consequences of government intervention and the equilibrium of supply and demand.
- Use examples from the simulation activities in order to explain intervention by the government in the demand and supply equilibrium.
- Analyze how changes in prices influence consumer demand and producer supply.
Example
Supply and demand equilibrium is disrupted whenever the government uses one or more of its powers to intervene in the market. Businesses are inclined to decrease the costs at which they offer their products for sale, thereby stimulating consumer demand for such commodities when the government offers financial assistance to them. (Stansak, 2020). An imbalance is corrected by the demand and supply forces of the market when the purchasing power of consumers is diminished as a result of a reduction in taxes imposed by the government on manufactured goods. Conversely, inequities between supply and demand typically result in price increases.
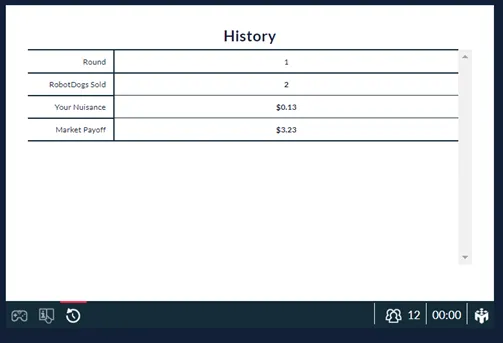
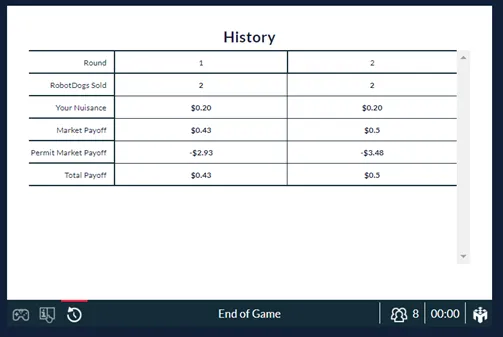
Government intervention in the market’s equilibrium between supply and demand is illustrated through the simulation game. Its intervention lowers the expenses of each item in the game, which causes their worth to stay the same or even be raised. Thus, it decreases the cost associated with addressing nuisances per individual. The items’ supply curve shifts towards the right, which means it rises, and equilibrium demand rises because the government lowers prices, which increases customers’ purchasing power and shifts the supply-demand balance.
Specify which government interventions cause a consumer or producer surplus. Explain how they impact consumers or produce a surplus. Provide examples from the textbook.
Evaluating Consumer or Producer Surplus
We will evaluate consumer and producer surplus for the last section of ECO 201 4-2 Simulation Checkpoint Assignment.
- Consider the effect that government taxes have on surpluses of producers and consumers.
- Identify government interventions that result in surpluses for consumers and producers.
- Use examples from the simulation games to illustrate the effects of government actions on consumer and producer surplus.
- Evaluate how government interventions, such as price controls and import tariffs, affect consumer and producer surplus.
Example
The imposition of taxes by the government may result in an economic surplus for both producers and consumers. It is more significant how taxes reduce the surpluses of consumers and farmers than the exact quantity of tax paid, whether directly or indirectly. For instance, a $1,000 per gallon milk tax does not generate any additional tax revenue because it ceases legal milk production. On the contrary, the implementation of this tax induces substantial economic harm by depriving both producers and consumers of surplus. (Mankiw, 2021). Additionally, taxes reduce the volume of commerce as a whole, which reduces earnings. An increase in consumer prices results in an equivalent reduction in consumer surplus. A reduction in supplier prices results in an equivalent decrease in surplus capacity or profit. Further instances of government intervention that result in consumer and producer surpluses include import tariffs, price controls, and price ceilings.
Closing
Analyzing competitive markets and externalities is essential for understanding the role of government intervention in correcting market failures. Following the How-To Guide ECO 201 4-2 Simulation Checkpoint Assignment, you can report your simulation game experiences and address various government intervention options effectively.
You can also read our ECO 201 next module 5-2 Simulation Discussion: Production, Entry, and Exit.
References
Bowles, S., & Carlin, W. (2020). What Students Learn in Economics 101: Time for a Change. Journal of Economic Literature, 58(1), 176–214. https://doi.org/10.1257/jel.20191585
Mankiw, N. G. (2021). Principles of Economics (9th edition). Cengage Learning, Inc.
Stansak, J. (2020, November 15). The Effects of Government Intervention in Markets | Fiveable. https://library.fiveable.me
ECO 201 5-2 Simulation Discussion: Production, Entry, and Exit
Instructions for ECO 201 5-2 Simulation Discussion
Discussion
In a competitive market, there are many buyers and sellers. The goods offered are largely the same, and firms can freely enter or exit the market. Buyers and sellers are both price takers. The amount of output produced determines the revenue of a firm.
First, play the simulation game Production, Entry, and Exit in the MindTap environment. In this discussion, you will share your experiences playing that game. Your work in this discussion will directly support your success on the course project.
In your initial post, include the image of your simulation report in your response. See the How to Submit a Simulation Report Image PDF document for more information. Then, address the following questions:
- Imagine you own your own business. Based on what you learned from the simulation, what factors would determine your entry and exit into a market?
- Applying the concept of marginal costs, how would you, as a business owner, decide how much to produce?
- How does the impact of fixed costs change production decisions in the short run and in the long run? Refer to the average total cost (ATC) model included in the textbook to demonstrate.
In your responses, comment on at least two posts from your peers. Research and provide examples from the news of firms in perfectly competitive markets. Discuss with your peers how costs impact these firms’ profitability.
To access your simulations, click the simulation link found in the module.
To complete this assignment, review the Module Five Simulation Discussion Rubric.
Introduction to ECO 201 Simulation Discussion
This eco 201 module 5 discussion, How-To Guide, is designed to help you navigate the complex decisions involved in managing a business as simulated in a microeconomic environment. By understanding factors that influence market entry and exit, calculating production based on marginal costs, and analysing the role of fixed costs, you can solve the ECO 201 5-2 Simulation Discussion: Production, Entry, and Exit. This Owlisdom How-To Guide will encourage active engagement with peers by discussing real-world applications of these concepts.
Imagine you own your own business. Based on what you learned from the simulation, what factors would determine your entry and exit into a market?
Assessing Market Entry and Exit Factors
For the first section of the ECO 201 5-2 Simulation Discussion: Production, Entry, and Exit, we will assess market entry and exit concerning our business.
- Reflect on your simulation experience to evaluate your business’s competitive landscape and potential customer base.
- Analyse how the number of competitors and the market size affect potential profits.
- Decide on market entry or exit by comparing the marginal cost of production with the market price and average total cost.
Example
As a company owner, one of the most important things to consider is the level of competition in the industry I am considering entering or leaving. The simulation demonstrates how the number of competitors that provide the same service or product as you may significantly impact your earnings—the greater the number of sellers, the lower the possible profit. In addition to this, the quantity of potential customers is also essential. You can’t make money if you don’t have anyone to sell to. Because of this, the proportion of buyers to sellers in any market is a significant factor since it establishes the overall landscape of demand and supply in that particular market (Fernando, 2021). It is profitable to join a market if the marginal cost matches the product’s value and is lower than the average cost at that quantity. On the other hand, if my company thinks that making a product will make less money than it costs to make, we will leave the market. In other words, the company is not profitable if the price of its product is lower than the average total cost of production.
Applying the concept of marginal costs, how would you, as a business owner, decide how much to produce?
Determining Production Quantity via Marginal Costs
Next, in ECO 201 5-2 Simulation Discussion: Production, Entry, and Exit. We will determine the production quantity using marginal cost concepts.
- Use the marginal cost concept to determine the optimal production level that maximises profits.
- Assess how many units need to be produced to cover overhead costs by analysing sales trends and production capacity.
Example
The optimal output level for maximum profit is determined by marginal cost. (Mankiw, 2021). At this price, the marginal cost of producing the product is zero. If I were in charge of a company, I’d research sales trends to determine how many units would need to be manufactured to cover overhead. To do so, I must assess my workforce requirements, calculate the square footage and equipment I’ll need to simulate a specific output, and think about several ways to streamline production. I need these systems to function fully so my company can earn money.
How does the impact of fixed costs change production decisions in the short and long run? Refer to the average total cost (ATC) model included in the textbook to demonstrate.
Impact of Fixed Costs on Production Decisions
For this section of ECO 201 5-2 Simulation Discussion: Production, Entry, and Exit, we will discuss the impact of fixed costs on production decision-making.
- Refer to the ATC model from your textbook to understand how fixed costs impact production in the short and long run.
- Consider the initial investments in production capacity and how these costs are amortised over time.
Example
Due to the need to sell more units of goods to break even, fixed expenses negatively influence short-term earnings. Each additional unit sold generates a more prominent profit once fixed expenses have been covered. Since fixed costs often have a lower margin of income with more significant production volumes, they favour production choices in the long term. In the early stages of a company’s development, for instance, it may invest in low-priced manufacturing equipment to generate enough revenue (profits) to cover expenses until the company can find its footing. When they have saved up enough money, they will invest in newer, more costly machinery, which will cost more initially but will save them money in the long run due to its reliability and productivity. Although this method may reduce earnings in the near term, it will boost profits in the long run as the enhanced production efficiency more than makes up for the higher initial investment in the more costly equipment.
In your responses, comment on at least two posts from your peers. Research and provide examples from the news of firms in perfectly competitive markets. Discuss with your peers how costs impact these firms’ profitability.
Peer Responses
Responding to peers is one of the vital parts of the ECO 201 5-2 Simulation Discussion: Production, Entry, and Exit posts. We need to provide at least two peer responses. I will provide one example post. You can write your peer responses by keeping the following points in mind.
- Comment on at least two peer posts to discuss their experiences and analyses.
- Research and provide examples of firms in perfectly competitive markets and how costs affect profitability.
Response 01
I believe that once we begin playing, we will all conclude that it is far easier to comprehend the inner workings of these simulations. This simulation, in my opinion, was an effective way to demonstrate how significant an influence both fixed expenses and market competition had on sales and ultimate profitability. This is reflected in the agricultural market in the United States because it is almost as competitive as it is possible to get without really being fully competitive (Mankiw, 2021). This is because there is a significant number of vendors, and not a single seller can unilaterally affect the price of a product. Because the market is entirely unregulated, the customers are unrestricted in their ability to choose whatever vendor best suits their needs (Westfall, 2022). As a result, the profitability of sellers in this market is significantly influenced by fixed costs, such as the cost of manufacturing.
Closing
By carefully applying the principles discussed in this guide, students can effectively simulate and analyse the dynamics of entering and exiting markets, making production decisions, and understanding the impacts of costs. The ECO 201 5-2 Simulation Discussion: Production, Entry, and Exit enhances learning and prepares students for real-world business strategy and economic analysis. You can also read our ECO 201 next module 6-2 Simulation Discussion: Monopolies and Monopolistic Competition.
References
Fernando, J. (2021, November 7). Law of Supply and Demand in Economics: How It Works. Investopedia. https://www.investopedia.com/terms/l/law-of-supply-demand.asp Mankiw, N. G. (2021). Principles of Economics (9th edition). Cengage Learning, Inc.
Westfall, P. (2022, May 1). Microeconomics Definition, Uses, and Concepts. Investopedia. https://www.investopedia.com/terms/m/microeconomics.asp
ECO 201 6-2 simulation discussion: monopolies and monopolistic competition
Instructions for ECO 201 6-2 simulation discussion
Overview
A monopoly is a firm that is the sole seller in a market. Monopolies can decide to set different prices for different consumers through price discrimination. In monopolistic competition, many firms sell products that are similar but not identical.
First, play the simulation game Price Discrimination in the MindTap environment. In this discussion, you will share your experiences playing that game. Your work in this discussion will directly support your success on the course project.
In your initial post, include the image of your simulation report in your response. See the How to Submit a Simulation Report Image PDF document for more information. Then, address the following questions:
- Explain which types of market inefficiencies derive from monopolies. Use examples from the textbook to support your claims.
- Describe the types of inefficiencies that derive from monopolistic competition. Use examples from the textbook to support your claims.
- How are monopolies and monopolistically competitive firms profitable? Use examples from the textbook to support your analysis.
In your responses, comment on at least two posts from your peers by providing examples from the news of monopolies and firms in monopolistic competition markets. Compare and contrast the two types of markets.
To access your simulations, click the simulation link found in the module.
To complete this assignment, review the Module Six Simulation Discussion Rubric.
Introduction to ECO 201 6-2 Simulation Discussion
This Owlisdom How-To Guide aims to help you delve into the complexities of monopolies and monopolistic competition, explicitly focusing on market inefficiencies and profitability. You can better understand these market structures and their economic impacts to solve ECO 201 6-2 simulation discussion: monopolies and monopolistic competition.
Explain which types of market inefficiencies derive from monopolies. Use examples from the textbook to support your claims.
Market Inefficiencies in Monopolies
To solve the ECO 201 6-2 simulation discussion, which is about monopolies and monopolistic competition, we will first play the simulation game given in the instructions and discuss the types of market insufficiencies.
- Identify critical characteristics of monopolies that lead to market inefficiencies, such as lack of competition and price setting above marginal cost.
- Discuss the concept of deadweight loss and how monopolies can result in reduced consumer surplus.
- Use textbook examples to illustrate these points, such as the dominance of a company like Facebook in social media.
Example
We have imperfect or monopolistic competition in monopolistic marketplaces when there are many suppliers but few replacements because of factors like price, quality, and availability. In the case of a monopoly game, one company disregards how its pricing actions impact its competitors and accepts the costs paid by other companies as given (Mankiw, 2021). Unlike totally competitive markets, monopolies do not lose their ability to replace themselves. Monopoly competition models are frequently used in industry models. Market structures that resemble monopolies include those found in restaurants, breakfast cereals, apparel, footwear, and the urban services sector. Monopolies will never grow inefficient since they are exempt from market competition from other producers. Take Facebook as an instance.
It is a monopoly as the dominant social media platform due to the fact that no other services can contend pretty. It may also lose its effectiveness due to the unavoidable deadweight loss. Due to the high cost and low production, this has happened. “Because a monopoly charges a price above marginal expense, not everyone who appreciates the commodity more than its cost buys it.”
Describe the types of inefficiencies that derive from monopolistic competition. Use examples from the textbook to support your claims.
Inefficiencies in Monopolistic Competition
Next, in ECO 201 6-2 simulation discussion: monopolies and monopolistic competition. We will discuss the inefficiencies that derive from monopolistic competition.
- Explain the structure of monopolistic competition, where many firms sell similar but not identical products.
- Discuss inefficiencies such as firms operating with excess capacity and setting prices above marginal cost.
- Use examples from sectors like restaurants or clothing where monopolistic competition is prevalent.
Monopolistic competition may be ineffective in one of two ways:
- A business will charge a price higher than its marginal cost if it is unable to produce units with a consumer value above the cost of production.
- Many enterprises do not utilise all of their production capacity because they have some extra capacity. As a result, in monopolistic competition, output is not equal to maximum profit.
How are monopolies and monopolistically competitive firms profitable? Use examples from the textbook to support your analysis.
Profitability in Monopolistic Markets
For the last section of the ECO 201 6-2 simulation discussion on monopolies and monopolistic competition, we will discuss the profitability of a monopolistic market.
- Describe how both monopolies and monopolistically competitive firms aim to maximise profits.
- Discuss how these firms equate marginal revenue with marginal cost to determine the optimal output level.
- Highlight how the profitability of these firms changes in the short run versus the long run.
Example
“Monopolistically competitive markets do not have all the desirable welfare properties of perfectly competitive markets.”
Every customer will pay the same amount to buy a product from a monopoly. Goods should be sold in smaller quantities at a higher price. As with every monopoly, there is no rivalry. Customers only purchase a product if they judge its value as equal to its cost. Therefore, the monopoly’s output and sales could be more efficient relative to some benchmarks. Deadweight loss describes this phenomenon. Overcharging might cause the company to lose prospective customers. Similar to a monopoly, monopolistic competition seeks to maximise profits by increasing output until the firm’s marginal income and marginal costs are identical. The position of the maximising profits quantity on the average revenue curve will determine the optimal selling price for the product. There is no differentiation in pricing practices between businesses in the monopoly competition since firms have similar market power. Long-term demand is very elastic or responsive to changes in price. Profit in the economy is favourable in the short term but tends to reach zero over time.
In your responses, comment on at least two posts from your peers by providing examples from the news of monopolies and firms in monopolistic competition markets. Compare and contrast the two types of markets.
Peer Responses
Responding to peers is one of the vital parts of the ECO 201 6-2 simulation discussion: monopolies and monopolistic competition posts. We need to provide at least two peer responses. I will provide one example post. You can write your peer responses by keeping the following points in mind.
- Comment on at least two peer posts to engage with different viewpoints and analyses.
- Research and present real-world examples of monopolies and monopolistic competition firms, comparing their market behaviours and profitability.
Response 01
When there is a mismatch between supply and demand, the result is a deadweight loss and market inefficiency. When products in a market are overpriced or underpriced, the market is inefficient. Some people in society may reap benefits from the imbalance, but the change from equilibrium will harm others.
The Monopoly market structure is characterised by free entry and exit, a feature of competitors, and differentiation in products, a feature of monopolies (Mankiw, 2021). Due to the fact that each company’s products are distinct, they wield some market influence. The sloping demand curves of all products are the result of advertising and marketing emphasising their distinctive selling factors. Every business would be in perpetual competition with each other and, over time, would generate equivalent profits if admission were free. Until the economic profits of a monopolistic competitor reach zero, there will be entry.
Closing
Understanding monopolies and monopolistic competition is crucial for grasping broader economic concepts and their practical implications. Through this ECO 201 6-2 simulation discussion: monopolies and monopolistic competition assignment, you will explore how market structures influence business decisions and financial outcomes. Engaging with peers and analysing real-world examples will enrich your learning experience, providing a deeper insight into how these markets operate and evolve. You can also read our ECO 201 next module, Module 7 Simulation Discussion: Oligopolies.
ECO 201 Module 7 Simulation Discussion: Oligopolies
Instructions for ECO 201 Module 7 Simulation Discussion
NOTE THAT A CUSTOM RUBRIC IS USED FOR THIS DISCUSSION.
An oligopoly is a market structure in which only a few sellers produce similar or identical products. Oligopolies are price-setters and can collude to behave like a monopolist.
First, play the simulation game Cournot in the MindTap environment. In this discussion, you will share your experiences playing that game. Your work in this discussion will directly support your success on the course project.
In your initial post, include the image of your simulation report in your response. See the How to Submit a Simulation Report Image PDF document for more information. Then, address the following questions:
- What are the main features of an oligopolistic market?
- How do oligopolies set their prices?
- Explain how you can distinguish a firm in an oligopolistic market from one in a monopolistically competitive market. Provide examples to illustrate.
In your responses, comment on at least two posts from your peers by providing examples from the news of oligopolistic markets. Compare and contrast with examples of monopolistic competitive markets.
To access your simulations, click the simulation link found in the module.
To complete this assignment, review the Module Seven Simulation Discussion Rubric.
Introduction to ECO 201 Module 7 Simulation Discussion
This Owlisdom How-To Guide is intended to assist you in understanding the dynamics of oligopolistic markets as part of their economics course. By exploring the distinctive features of these markets, their pricing strategies, and how they differ from monopolistic competition, you can quickly solve ECO 201 Module 7 Simulation Discussion: Oligopolies. This knowledge is fundamental in analyzing real-world economic scenarios effectively.
What are the main features of an oligopolistic market?
Features of Oligopolistic Markets
We will play the simulation game, instructed to solve the ECO 201 Module 7 Simulation Discussion: Oligopolies. Then, we will discuss the main features of an oligopolistic market.
- Identify the small number of firms that dominate the market, highlighting their market power.
- Discuss the high barriers to entry that protect these firms from new competitors.
- Explain the concept of interdependence among oligopolistic firms, where each firm’s actions affect the others.
- Oligopolies are characterized by few companies holding significant market control, making it difficult for new entrants and leading to strategies often responsive to competitors’ actions.
Example
The increased obstacles to entry are the second characteristic that sets an oligopolistic market apart. (Mankiw, 2021). Because of the high initial expenses and diminished competitive advantage you will have over already established enterprises, it isn’t easy to enter a booming market. An attribute of oligopolistic markets that sets them apart is their interdependence. Interdependence occurs when the pricing or marketing tactics of another impact a firm. Companies frequently don’t cut expenses in oligopolistic markets in an effort to obtain a competitive advantage.
How do oligopolies set their prices?
Pricing Strategies in Oligopolies
Next, in ECO 201 Module 7 Simulation Discussion: Oligopolies. We will discuss the pricing strategies of oligopolistic markets.
- Describe how oligopolists weigh the production effects against the pricing effects when setting prices.
- Explain scenarios where firms might increase production to boost sales without sacrificing profit margins.
- In oligopolies, pricing is strategic and often involves considering how price changes affect overall market dynamics, not just individual firm outcomes.
Example
Oligopolists must balance their impact on pricing and production when determining prices. The manufacturing effect of providing only one additional gallon will increase earnings when the price is higher than the marginal cost. In reaction to pricing adjustments, water firms are increasing output in order to improve overall sales without compromising profit margins. The owner will boost production if the impact on output outweighs the impact on price. The owner won’t increase production if the effects on cost outweigh the benefit.
Explain how you can distinguish a firm in an oligopolistic market from a monopolistic competitive market. Provide examples to illustrate.
Distinguishing Oligopolistic Firms from Monopolistic Competition
This section of ECO 201 Module 7 Simulation Discussion: Oligopolies will explain the difference between monopolistic and oligopolistic competition.
- Compare the competitive environment and barriers to entry in oligopolies versus monopolistic competition.
- Use examples, such as hotels for monopolistic competition and large utility companies for oligopolies, to illustrate these differences.
Example
Businesses that engage in oligopolistic behavior can be identified as monopolies by a number of essential traits. Minimal amounts of competition and significant entrance restrictions characterize oligopolies. In contrast, Monopolies allow for limitless opportunities to enter and leave the marketplace and a large number of small businesses providing comparable or identical products and services. An oligopolistic market is one where a handful of enterprises dominate the market. In their industry, very few companies have undue power, and those who do often collaborate to their detriment as customers. One of the best examples of monopolistic competition is the hotel industry. These companies are fierce competitors, but they all have something special that sets them apart.
In your responses, comment on at least two posts from your peers by providing examples from the news of oligopolistic markets. Compare and contrast with examples of monopolistic competitive markets.
Peer Responses
Responding to peers is one of the vital parts of the ECO 201 Module 7 Simulation Discussion: Oligopolies posts. We need to provide at least two peer responses. I will provide one example post. You can write your peer responses by keeping the following points in mind.
- Engage with at least two peer posts, providing thoughtful comments and drawing on real-world examples.
- Compare and contrast the examples provided by peers with those of well-known oligopolies and monopolistic competitive markets.
Response 01
Hey Jordan! You did a great job explaining the complexities of oligopolistic markets, like the high barriers to entry and the interdependence among firms. For instance, major airlines like Delta and United often demonstrate oligopolistic behavior as they set competitive prices that others in the industry usually follow, impacting overall market pricing strategies. On the contrary, the restaurant industry exemplifies monopolistic competition, where many establishments offer similar yet slightly differentiated products, allowing for easy market entry and exit (Dam, 2019). Each has unique traits affecting pricing and competition strategies.
Response 02
I have addressed the given instructions in one response. Following these instructions, you can quickly write your peer responses to Simulation Discussions without a hassle.
Closing
Understanding oligopolistic and monopolistic competitive markets is essential for analyzing economic environments effectively. Through ECO 201 Module 7 Simulation Discussion: Oligopolies, you will explore critical aspects of these markets, enhancing your ability to apply economic theories to academic and real-world contexts. You can also read our ECO 201 next module, 8-1 Project Submission.
References
Dam, A. V. (2019, October 17). Analysis | Economists identify an unseen force holding back affordable housing. Washington Post. https://www.washingtonpost.com/business/2019/10/17/economists-identify-an-unseen-force-holding-back-affordable-housing/
Mankiw, N. G. (2021). Principles of Economics (9th edition). Cengage Learning, Inc.
ECO 201 8-1 Project Submission
Instructions of ECO 201 8-1 Project Submission
Scenario
You and your friend from college have just graduated. You majored in business, and your friend majored in a creative field. Your friend is highly inventive and has come up with an excellent idea for a new product. You both believe in this idea so much that you have agreed to become business partners. However, before you embark on your entrepreneurial adventure, you will have to explain some key microeconomics concepts to your partner that are important to make sound business decisions.
Your business partner is less than enthusiastic about this prospect and has never had an interest in what is often described as the dry and boring field of economics. Every time you have tried to engage your partner in practical discussions, they brush you off and decide to go play video games instead.
Aha! This gives you an idea: What if you could convince your friend to learn about economics through games? You have found several simulation games that demonstrate in real and interesting ways the economic principles that you know your partner needs.
Once you have played the games, you will create a memorandum report summarizing for your friend the educational value of your experiment. In your memorandum, you will restate the key principles and takeaways of each simulation, as well as illustrate how these ideas are relevant to your future entrepreneurial success.
Directions
First, assemble the materials that you will need to complete this assignment:
- You will need several simulation report images for your memorandum. All the necessary data visualizations will be generated after you have completed each simulation game. You will be required to save image files of your simulation reports for your simulation discussions. These should also be used to create your memorandum report for the course project. If you have any questions or concerns about the simulation data that should be used for your project, you should promptly reach out to your instructor.
- Review and use the Project Template located in the What to Submit section.
You are expected to reference any source material used in your memorandum report with appropriate citations. To support you, a References page has been added to the project template with a citation for this course’s reading already provided. Any other references you add should be cited according to APA format.
Once you have assembled the required materials listed above, you can now begin drafting your memorandum report by completing the following steps:
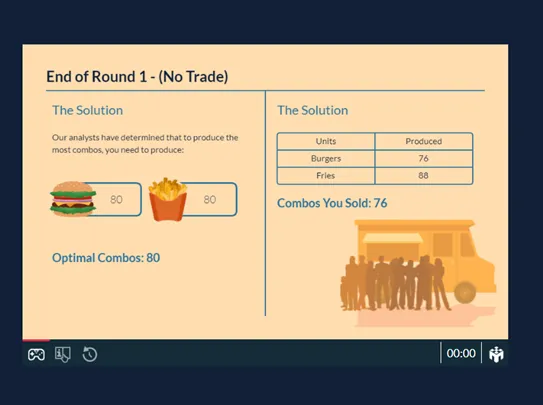
- Comparative Advantage: Discuss the Comparative Advantage (With Trade) simulation that you played in Module Two. You should add the Production Decisions graph and the Production Trade graph (i.e., the graph showing how many hamburgers per fries) from your simulation report into the project template as Figures 1.1 and 1.2. Then, answer the following questions in the paragraphs below the figures:
- How does this simulation demonstrate how individuals evaluate opportunity costs to make business decisions? Use the Production Decisions graph from the simulation as a reference to explain what role the production-possibility frontier (PPF) has in the decision-making process.
- Explain how comparative advantage impacts a firm’s decision to engage in trade. Would a business’s decision to trade cause a change to its PPF? Provide specific reasoning to support your claims.
- Competitive Markets and Externalities: Discuss the Competitive Markets and Externalities simulations (both with and without policy interventions) that you played in Modules Three and Four. Add the Supply and Demand chart and the Outcomes by Market table from your simulation reports into the project template as Figures 2.1 and 2.2. Then, answer the following questions in the paragraphs below the figures:
- What impact do policy interventions have on the supply and demand equilibrium for a product? Provide specific examples from the simulation to illustrate.
- What are the determinants of price elasticity of demand? Identify at least three examples. Based on the outcome of the simulation, explain how price elasticity can impact pricing decisions and total revenue of the firm.
- Based on the results of the simulation, can policy market interventions cause consumer or producer surplus? Explain why using specific reasoning.
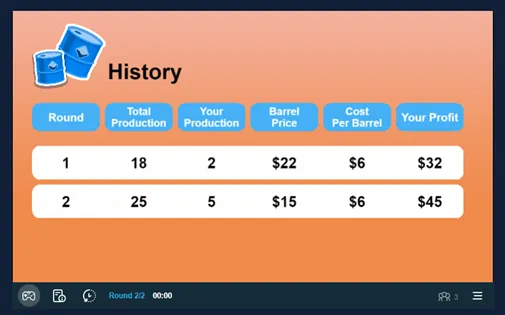
- Production, Entry, and Exit: Discuss the Production, Entry, and Exit simulation that you played in Module Five. Add the Aggregate Outcomes chart from your simulation report into the project template as Figure 3.1. Then, answer the following questions in the paragraphs below the figure:
- Analyze a business owner’s decision-making regarding whether to enter a market. For example, what factors determined the driver’s market entry and exit in the simulation? Use economic models to support your analysis.
- How does a business owner applying the concept of marginal costs decide how much to produce? For example, how did the driver determine how many hours to drive each day? Use economic models to explain.
- How does the impact of fixed costs change production decisions in the short run and in the long run? Use the average-total-cost (ATC) model included in the module reading chapters to demonstrate this impact.
- Market Structures: Discuss the market structures simulations (Price Discrimination and Cournot) that you played in Modules Six and Seven. Then, do the following in the project template:
- Complete Table 4.1 as a reference guide for your business partner. The table should compare the attributes of each of the four listed market structures.
- Answer the following questions in the paragraphs below the table:
- Explain what market inefficiencies derive from monopolies and monopolistic competition. Use examples from the textbook to support your claims.
- How do firms in an oligopolistic market set their prices? Use specific examples from the simulations or from the textbook to support your claims.
- Explain how firms that compete in the four different market structures determine profitability. Use specific examples from the simulations or the textbook to support your claims.
- Conclusions: Draw your overall conclusions about the relevance and significance of microeconomics. How will microeconomics principles impact your business decisions moving forward? Provide recommendations to your business partner for your future business venture.
- Finally, ensure that all of your sources are properly cited using in-line citations and references according to APA format.
What to Submit
To complete this project, you must submit the following:
Memorandum Report
Your memorandum report should summarize the key principles and takeaways of each
microeconomics simulation for your business partner. It should also illustrate how these ideas are relevant to your
future entrepreneurial success.
Template: Project
Template Word Document
Use this template to structure your memorandum report, and submit it as a Word
document. Sources should be cited according to APA style.
Supporting Materials
The following resources support your work on the project:
Video: How to Use the Snipping Tool
(Beginner’s Guide) (for PC) (5:23)
Use this tutorial for help with snipping, copying, and pasting
your data visualizations into your project template.
A captioned version of this video is available: How to Use the Snipping Tool (Beginner’s Guide) (CC) Video.
Resource: Is There a Snipping Tool
for Mac?
Use this tutorial for help with snipping, copying, and pasting your data visualizations into
your project template.
Resource: APA Style
Basics
Use this resource to support your in-line citations and full references in the References
section of your project template.
Introduction to ECO 201 8-1 Project Submission
This Owlisdom How-To Guide is designed to help you understand and apply critical microeconomic principles through simulation games. The eco 201 module 8 project involves engaging with several simulations that demonstrate real-world applications of these principles to enhance decision-making in business scenarios. By the end of this ECO 201 8-1 Project Submission guide, you will be able to draft a memorandum that effectively communicates the educational value and practical implications of microeconomic concepts.
You will receive a Project Template to solve the Eco 201 module 8 project. I am using the SNHU template as an example.
You will need several simulation report images for your memorandum. All the necessary data visualizations will be generated after you have completed each simulation game. You must save image files of your simulation reports for your simulation discussions. These should also be used to create your memorandum report for the course project.
Simulation
To start the ECO 201 8-1 Project Submission, we will first play the simulations mentioned in previous modules and gather the result reports. We will solve the 8-1 Project according to our simulation findings.
- Simulation Report Images: After playing each simulation game, capture and save images of all the simulation reports. These images will be critical for your memorandum to support your discussions visually.
Comparative Advantage: Discuss the Comparative Advantage (With Trade) simulation you played in Module Two. You should add the Production Decisions graph and the Production Trade graph (i.e., the graph showing how many hamburgers per fries) from your simulation report into the project template as Figures 1.1 and 1.2. Then, answer the following questions in the paragraphs below the figures: How does this simulation demonstrate how individuals evaluate opportunity costs to make business decisions? Use the Production Decisions graph from the simulation as a reference to explain the role of the production-possibility frontier (PPF) in the decision-making process. Explain how comparative advantage impacts a firm’s decision to engage in trade. Would a business’s decision to trade cause a change to its PPF? Provide specific reasoning to support your claims.
Understanding Comparative Advantage
For the second section of ECO 201 8-1 Project Submission, we will discuss the comparative advantage.
- Play the Comparative Advantage Simulation: Focus on how different production choices affect opportunity costs and the production possibility frontier (PPF).
- Include Graphs in the Memorandum: Insert the Production Decisions and Production Trade graphs into your report as figures. These will visually support your analysis.
- Discuss Key Concepts: Explain how the simulation evaluates opportunity costs in business decisions and how comparative advantage influences trade decisions.

Example
Opportunity costs are the potential gains that a person, investor, or corporation foregoes while selecting one choice over another. Opportunity costs are invisible, making them easy to miss. Knowing the possibilities that may be lost when one investment choice is chosen over another helps make more informed decisions. (Fernando, 2022). The opportunity cost is the gain that would have been obtained if a different alternative had been taken. To correctly assess opportunity costs, the costs and advantages of each possible choice must be analyzed and compared against one another. When making decisions for myself and my company, considering the worth of opportunity costs will help me make more beneficial decisions. Opportunity cost is an internal expense used for strategic planning; it is not included in accounting profit and is not reported externally. Opportunity cost may be seen in decisions like building a new factory in New York rather than Ohio, delaying an update to firm equipment, or selecting the most costly product packaging choice.
The principle of comparative advantage suggests that efforts should be concentrated where they will have the most impact. (Learn Economics, 2022). It refers to our capacity to generate something faster than others. It refers to the ability to create something with fewer resources. Let us imagine we are attempting to determine what to prepare for supper. Assume you are a good chef, and I am not. You are capable of making a more excellent steak than I am. This is referred to as your comparative advantage.
The production possibility frontier (PPF) is a curve that depicts the potential amounts of two goods if they rely on the same limited resources for manufacturing. (Bloomenthal, 2022). Moreover, PPF is quite essential in the realm of economics. For instance, it might show that a country’s economy has attained maximum achievable efficiency. Businesses and economists use the PPF to consider potential production scenarios by adjusting various resource factors. Companies might use the PPF to discover how factors affect production or to pick which items to develop. Economists may use it to determine how much of one product can be produced in a nation while not making another, allowing them to examine economic efficiency and growth.
Competitive Markets and Externalities: Discuss the Competitive Markets and Externalities simulations (both with and without policy interventions) that you played in Modules Three and Four. Add the Supply and Demand chart and the Outcomes by Market table from your simulation reports into the project template as Figures 2.1 and 2.2. Then, answer the following questions in the paragraphs below the figures: How do policy interventions affect a product’s supply and demand equilibrium? Provide specific examples from the simulation to illustrate. What are the determinants of price elasticity of demand? Identify at least three examples. Based on the outcome of the simulation, explain how price elasticity can impact pricing decisions and the firm’s total revenue. Based on the simulation results, can policy market interventions cause consumer or producer surplus? Explain why using specific reasoning.
Analyzing Competitive Markets and Externalities
Next, in ECO 201 8-1 Project Submission. We will analyze the market competitiveness and externalities.
- Engage with the Simulations on Competitive Markets and Externalities: Play both simulations to understand the effect of government policies on market equilibria.
- Visual Aids: Include the Supply and Demand chart and the Outcomes by Market table in your report.
- Address Specific Questions: Explore the impact of policy interventions on supply and demand, discuss the price elasticity of demand, and consider how market interventions might affect consumer and producer surplus.


Example
When an externality causes a market failure and inefficient resource allocation, the government can take Command and Control (CAC) or market-based policies. (Mankiw, 2021). By contrast, market-based policies incentivize private decision-makers to address the issue independently, whereas CAC policies regulate conduct directly. Depending on the nature of the externality, CAC strategies may seek to incentivize or discourage particular actions. The government may implement a CAC approach in which the Environmental Protection Agency limits pollutants that businesses may release into the atmosphere. Because of this rule, companies must conduct themselves according to specific criteria. Examples of market-based policies include remedial taxes and subsidies and the ability to exchange pollution permits. (Bowles & Carlin, 2020). The usage of corrective taxes is one method that may be utilized to ensure that private decision-makers are aware of the societal costs that they need to consider in conjunction with the unfavorable externality. One illustration of this would be the Environmental Protection Agency’s ability to charge businesses a fee for each quantity of pollution such companies produce. Pollution licenses that may be bought and sold between businesses provide polluters a negotiating chip in the global war against pollution. If the Environmental Protection Agency determines that a firm can release a maximum of 500 tons of pollution per year but only emits 300, it can negotiate with another company to buy back the remaining 200 tons of dispersible pollution. The agreement benefits both businesses while maintaining compliance with the predetermined level of emissions that the Environmental Protection Agency had mandated.
Any time the government intervenes in the market using any of its powers, there are repercussions for the demand and supply equilibrium due to the resulting price shifts. When the government provides financial assistance to businesses, those businesses are more likely to reduce the prices at which they sell their products, which drives up consumer demand for those commodities. (Stansak, 2020). However, if the government levies taxes on manufactured products, it reduces consumers’ purchasing power, causing an imbalance corrected by the market’s supply and demand forces. Prices tend to rise if there is an imbalance between supply and demand, and vice versa.
The simulation game illustrates how government intervention affects the market’s demand and supply equilibrium. Because of its interference, the costs of each unit in the game are reduced; as a result, it produces a situation in which the worth of the units either remains the same or increases. Consequently, it reduces the number of nuisances per individual at a lower cost. So, we can say that the units’ supply curve moves to the right, which means it goes up; since equilibrium prices stay the same or go down, equilibrium demand also goes up when the government intervenes to lower the cost of an item. Customers’ purchasing power increases, which in turn shifts the supply and demand balance.
Government action, in the form of taxes, can lead to a surplus for consumers and producers. The extent to which consumer and producer surplus is reduced due to taxes is more important than the amount of tax paid directly or indirectly—for example, imposing a milk tax of $1000 per gallon results in no new tax income since legal milk production is halted. However, the imposition of this tax results in significant economic damage in the form of a loss of surplus for both consumers and producers (Mankiw, 2021). Further, taxes lessen the overall volume of commerce, which cuts into earnings. When consumer prices are raised, there is a corresponding decline in consumer surplus. When prices are lowered for suppliers, there is a corresponding decline in producer surplus or profit. Additional government involvement that leads to surpluses for consumers and producers are price controls, price ceilings, and import tariffs.
Production, Entry, and Exit: Discuss the Production, Entry, and Exit simulation that you played in Module Five. Add the Aggregate Outcomes chart from your simulation report into the project template as Figure 3.1. Then, answer the following questions in the paragraphs below the figure: Analyze a business owner’s decision-making regarding whether to enter a market. For example, what factors determined the driver’s market entry and exit in the simulation? Use economic models to support your analysis. How does a business owner apply the concept of marginal costs to decide how much to produce? For example, how did the driver determine how many hours to drive each day? Use economic models to explain. How does the impact of fixed costs change production decisions in the short and long run? Use the average-total-cost (ATC) model included in the module reading chapters to demonstrate this impact.
Examining Production, Entry, and Exit
We will discuss the production, entry, and exit for the next part of the ECO 201 8-1 Project Submission.
- Simulation on Production Decisions: Understand factors influencing a business’s decision to enter or exit a market.
- Incorporate Aggregate Outcomes Chart: This will help explain economic models and their application to real-world scenarios.
- Analyze Key Decisions: Discuss how marginal and fixed costs influence production decisions.
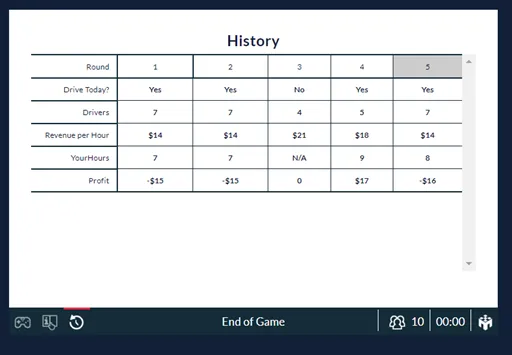
Example
It was fun going through the simulation and seeing whether I could accurately forecast events and increase my earnings as a driver. My choice to drive was mainly influenced by the daily set charge, as well as the number of other people who were driving on that particular day. It would not be worth it to drive on a day when the hourly salary is predicted to be low, since there would be too many drivers on the road. In other words, if there were more than five drivers, the set price would cause a loss in revenue.
As a company owner, one of the most important things to consider is the level of competition in the industry I am considering entering or leaving. The simulation demonstrates how the number of competitors that provide the same service or product as you may significantly impact your earnings—the greater the number of sellers, the lower the possible profit. In addition to this, the quantity of potential customers is also essential. You cannot make money if you do not have anyone to sell to. Because of this, the proportion of buyers to sellers in any market is a significant factor since it establishes the overall landscape of demand and supply in that particular market. (Fernando, 2021). It is profitable to join a market if the marginal cost matches the product’s value and is lower than the average cost at that quantity. On the other hand, if my company thinks that making a product will make less money than it costs to make, we will leave the market. In other words, the company is not profitable if the price of its product is lower than the average total cost of production.
The optimal output level for maximum profit is determined by marginal cost. (Mankiw, 2021). At this price, the marginal cost of producing the product is zero. If I were in charge of a company, I would research sales trends to determine how many units would need to be manufactured to cover overhead. To do so, I must assess my workforce requirements, calculate the square footage and equipment I will need to simulate a specific output, and think about several ways to streamline production. I need these systems to function fully so my company can earn money.
Due to the need to sell more units of goods to break even, fixed expenses negatively influence short-term earnings. Each additional unit sold generates a more prominent profit once fixed expenses have been covered. Since fixed costs often have a lower margin of income with more significant production volumes, they favor production choices in the long term. In the early stages of a company’s development, for instance, it may invest in low-priced manufacturing equipment to generate enough revenue (profits) to cover expenses until the company can find its footing. When they have saved up enough money, they will invest in newer, more costly machinery, which will cost more initially but will save them money in the long run due to its reliability and productivity. Although this method may reduce earnings in the near term, it will boost profits in the long run as the enhanced production efficiency more than makes up for the higher initial investment in the more costly equipment.
Market Structures: Discuss the market structures simulations (Price Discrimination and Cournot) you played in Modules Six and Seven. Then, do the following in the project template: Complete Table 4.1 as a reference guide for your business partner. The table should compare the attributes of each of the four listed market structures. Answer the following questions in the paragraphs below the table: Explain what market inefficiencies derive from monopolies and monopolistic competition. Use examples from the textbook to support your claims. How do firms in an oligopolistic market set their prices? Use specific examples from the simulations or the textbook to support your claims. Explain how firms that compete in the four different market structures determine profitability. Use specific examples from the simulations or the textbook to support your claims.
Exploring Different Market Structures
For this section of ECO 201 8-1 Project Submission, we will discuss the different types of market structures.
- Study Different Market Simulations: Focus on the characteristics of perfect competition, monopolistic competition, monopoly, and oligopoly.
- Complete and discuss Table 4.1: This table should outline the attributes of each market structure. Analyze how these structures affect pricing strategies and profitability.
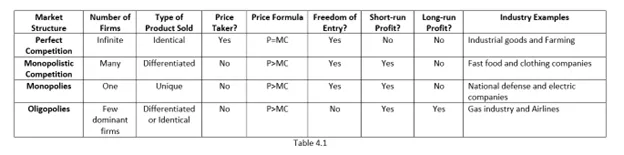
Example
In monopolistic markets, when there are many sellers but few substitutes due to price, quality, and availability, we have imperfect or monopoly competition. In the monopoly game, one corporation takes the prices paid by its rivals as a given and ignores how its pricing decisions affect its competitors. (Mankiw, 2021). Monopolies retain their replacement capacity, unlike perfectly competitive markets. Industry models often make use of monopoly competition models. Restaurants, breakfast cereals, clothing, footwear, and urban service sectors are examples of monopoly-like market systems. Since monopolies do not have to compete with other producers on the market, they can always be efficient. Consider Facebook as an example. It is a monopoly as the dominant social media platform since no other services can compete on a level playing field. Due to the inevitable deadweight loss, it might also become ineffective. Because of the high pricing and little production, this has occurred. “Because a monopoly charges a price above marginal expense, not everyone who appreciates the commodity more than its cost buys it.”
There are two ways in which monopolistic competition might be ineffectual:
- If a company fails to create units that customers value more than the cost of production, it will charge a price that is more than its marginal cost.
- Many businesses are not using all of their manufacturing capacity since they have some spare capacity. As a result, output falls short of maximum power in monopolistic competition.
To a large extent, oligopolistic markets are characterized by the same essential characteristics. For starters, a few firms exert disproportionate market dominance. Only a few stores make up most of the industry’s retail establishments. The second distinguishing aspect of an oligopolistic market is the higher barriers to entry. (Mankiw, 2021). It is challenging to enter a well-established market due to the high startup costs and reduced competitive advantage you will have compared to well-established businesses. A distinguishing aspect of oligopolistic marketplaces is their interconnectedness. When one firm is affected by the price or promotional strategies of another, it is an example of interdependence. In oligopolistic markets, companies often do not decrease costs to gain a competitive edge.
When setting prices, oligopolists have to weigh the influence on production against the impact on pricing. When the price is greater than the marginal cost, the production effect of selling only one more gallon will enhance earnings. Water companies are raising output to boost total sales without sacrificing profit margins in response to the price changes. If the influence on output exceeds the effect on the price, the owner will increase production. If the impact on output is less than the price, the owner will not expand production.
Companies that operate in an oligopolistic fashion may be distinguished from monopolies by several key characteristics. Low levels of competition and considerable entrance obstacles characterize oligopolies. In contrast, monopolistic competition has many small enterprises offering similar or identical goods and services and unlimited entry and exit from the market. One definition of an oligopolistic market is one in which a small number of firms have a dominant influence. Few firms exert undue influence in their industry and those that do frequently work together for their benefit at the expense of consumers. The hotel business is an excellent example of monopolistic competition. There is much rivalry amongst these businesses, but they each have something unique to offer that makes them stand out.
The following five conditions define a market as a perfect competition. To begin, the market is saturated with companies offering essentially the same service or product. Second, the companies are helpless as price takers because they cannot set prices. Third, since there are so many companies, no one has a dominant position in the market. As a fourth point, shoppers have full access to data on the market of products and their pricing. Getting into and out of the market is easy, which brings us to our fifth point. All companies eventually reach average earnings, and as a result, economic profits eventually fall to zero. The fast food sector is a good model of a market with perfect competition.
When companies offer comparable but not identical products or services, the market is said to have a monopolistic structure. All enterprises in this sector have relatively weak market power, and all market players share this weakness. There are a few restrictions on who may enter or leave the market, and the actions of individual businesses have little impact on the actions of their competitors. Economic profit is zero in the long term. The hotel business is a typical monopolistic competition market.
Three key factors characterize an oligopoly market. In the first market, only a few companies had a decisive influence. As a second point, companies’ goods or services are similar but are significantly distinguished thanks to branding and marketing. Third, there are exit and entrance restrictions in the market. The actions of industry leaders profoundly influence competitors’ choices. When enterprises work together to establish prices at which MR>MC, they may realize economic gains, but in the event of a price war, they may see no gain. The telecommunications business is an excellent example of an oligopoly market.
There is just one company operating in a monopoly market. Company X is the only provider of Product Y. It is difficult for new companies to enter the market, giving the dominant one significant competition. By pricing its offerings at a level where MC>MR, the company ensures that it will have long-term financial success. When the government licenses a monopoly to produce and sell a product, it locks out all other competitors for 17 years under patent protection. Therefore, the company may increase its prices and reap substantial economic benefits. Governments provide market protection to incentivize innovation and introduce new items to consumers.
Conclusions: Draw your overall conclusions about the relevance and significance of microeconomics. How will microeconomics principles impact your business decisions moving forward? Provide recommendations to your business partner for your future business venture.
Drawing Conclusions and Applying Principles
For the last part of the ECO 201 8-1 Project Submission, we will summarize the findings and provide conclusions by applying the learned principles.
- Synthesize Learning: Reflect on how the simulations illustrate microeconomic principles and their relevance to business decisions.
- Provide Practical Recommendations: Offer actionable advice based on your findings to assist your business partner in making informed decisions.
Example
Microeconomics applies basic concepts to foretell how individuals will act in certain situations, especially those involving economic or monetary transactions. These norms consider utility amplification, opportunity costs, and the rule of market interest. Moreover, corporations and other organizations may benefit from microeconomics.
We would form a fantastic team, and I am optimistic about our company’s prospects if you would take the time to study all this microeconomics material and better grasp its importance.
Closing
By following this How-To Guide, you will be equipped to create a comprehensive memorandum that effectively communicates the relevance of microeconomics to real-world business applications. This guide will equip you with the necessary guidelines in preparing them for thoughtful and strategic entrepreneurial activities to solve the ECO 201 8-1 Project Submission. You can also read our ECO 201 next module, 8-2 Discussions on Frontiers of Microeconomics.
References
Bloomenthal, A. (2022, August 17). Production Possibility Frontier (PPF): Purpose and Use in Economics. Investopedia. https://www.investopedia.com/terms/p/productionpossibilityfrontier.asp
Bowles, S., & Carlin, W. (2020). What Students Learn in Economics 101: Time for a Change. Journal of Economic Literature, 58(1), 176–214. https://doi.org/10.1257/jel.20191585
Fernando, J. (2021, November 7). Law of Supply and Demand in Economics: How It Works. Investopedia. https://www.investopedia.com/terms/l/law-of-supply-demand.asp
Fernando, J. (2022, June 27). Opportunity Cost Formula, Calculation, and What It Can Tell You. Investopedia. https://www.investopedia.com/terms/o/opportunitycost.asp
Learn Economics: The Law of Comparative Advantage – 2022. (2022, October 13). MasterClass. https://www.masterclass.com/articles/learn-economics-the-law-of-comparative-advantage
Mankiw, N. G. (2021). Principles of Economics (9th edition). Cengage Learning, Inc.
Stansak, J. (2020, November 15). The Effects of Government Intervention in Markets | Fiveable. https://library.fiveable.me
ECO 201 8-1 Project Submission
Instructions of ECO 201 8-1 Project Submission
Scenario
You and your friend from college have just graduated. You majored in business, and your friend majored in a creative field. Your friend is highly inventive and has come up with an excellent idea for a new product. You both believe in this idea so much that you have agreed to become business partners. However, before you embark on your entrepreneurial adventure, you will have to explain some key microeconomics concepts to your partner that are important to make sound business decisions.
Your business partner is less than enthusiastic about this prospect and has never had an interest in what is often described as the dry and boring field of economics. Every time you have tried to engage your partner in practical discussions, they brush you off and decide to go play video games instead.
Aha! This gives you an idea: What if you could convince your friend to learn about economics through games? You have found several simulation games that demonstrate in real and interesting ways the economic principles that you know your partner needs.
Once you have played the games, you will create a memorandum report summarizing for your friend the educational value of your experiment. In your memorandum, you will restate the key principles and takeaways of each simulation, as well as illustrate how these ideas are relevant to your future entrepreneurial success.
Directions
First, assemble the materials that you will need to complete this assignment:
- You will need several simulation report images for your memorandum. All the necessary data visualizations will be generated after you have completed each simulation game. You will be required to save image files of your simulation reports for your simulation discussions. These should also be used to create your memorandum report for the course project. If you have any questions or concerns about the simulation data that should be used for your project, you should promptly reach out to your instructor.
- Review and use the Project Template located in the What to Submit section.
You are expected to reference any source material used in your memorandum report with appropriate citations. To support you, a References page has been added to the project template with a citation for this course’s reading already provided. Any other references you add should be cited according to APA format.
Once you have assembled the required materials listed above, you can now begin drafting your memorandum report by completing the following steps:
- Comparative Advantage: Discuss the Comparative Advantage (With Trade) simulation that you played in Module Two. You should add the Production Decisions graph and the Production Trade graph (i.e., the graph showing how many hamburgers per fries) from your simulation report into the project template as Figures 1.1 and 1.2. Then, answer the following questions in the paragraphs below the figures:
- How does this simulation demonstrate how individuals evaluate opportunity costs to make business decisions? Use the Production Decisions graph from the simulation as a reference to explain what role the production-possibility frontier (PPF) has in the decision-making process.
- Explain how comparative advantage impacts a firm’s decision to engage in trade. Would a business’s decision to trade cause a change to its PPF? Provide specific reasoning to support your claims.
- Competitive Markets and Externalities: Discuss the Competitive Markets and Externalities simulations (both with and without policy interventions) that you played in Modules Three and Four. Add the Supply and Demand chart and the Outcomes by Market table from your simulation reports into the project template as Figures 2.1 and 2.2. Then, answer the following questions in the paragraphs below the figures:
- What impact do policy interventions have on the supply and demand equilibrium for a product? Provide specific examples from the simulation to illustrate.
- What are the determinants of price elasticity of demand? Identify at least three examples. Based on the outcome of the simulation, explain how price elasticity can impact pricing decisions and total revenue of the firm.
- Based on the results of the simulation, can policy market interventions cause consumer or producer surplus? Explain why using specific reasoning.
- Production, Entry, and Exit: Discuss the Production, Entry, and Exit simulation that you played in Module Five. Add the Aggregate Outcomes chart from your simulation report into the project template as Figure 3.1. Then, answer the following questions in the paragraphs below the figure:
- Analyze a business owner’s decision-making regarding whether to enter a market. For example, what factors determined the driver’s market entry and exit in the simulation? Use economic models to support your analysis.
- How does a business owner applying the concept of marginal costs decide how much to produce? For example, how did the driver determine how many hours to drive each day? Use economic models to explain.
- How does the impact of fixed costs change production decisions in the short run and in the long run? Use the average-total-cost (ATC) model included in the module reading chapters to demonstrate this impact.
- Market Structures: Discuss the market structures simulations (Price Discrimination and Cournot) that you played in Modules Six and Seven. Then, do the following in the project template:
- Complete Table 4.1 as a reference guide for your business partner. The table should compare the attributes of each of the four listed market structures.
- Answer the following questions in the paragraphs below the table:
- Explain what market inefficiencies derive from monopolies and monopolistic competition. Use examples from the textbook to support your claims.
- How do firms in an oligopolistic market set their prices? Use specific examples from the simulations or from the textbook to support your claims.
- Explain how firms that compete in the four different market structures determine profitability. Use specific examples from the simulations or the textbook to support your claims.
- Conclusions: Draw your overall conclusions about the relevance and significance of microeconomics. How will microeconomics principles impact your business decisions moving forward? Provide recommendations to your business partner for your future business venture.
- Finally, ensure that all of your sources are properly cited using in-line citations and references according to APA format.
What to Submit
To complete this project, you must submit the following:
Memorandum Report
Your memorandum report should summarize the key principles and takeaways of each
microeconomics simulation for your business partner. It should also illustrate how these ideas are relevant to your
future entrepreneurial success.
Template: Project
Template Word Document
Use this template to structure your memorandum report, and submit it as a Word
document. Sources should be cited according to APA style.
Supporting Materials
The following resources support your work on the project:
Video: How to Use the Snipping Tool
(Beginner’s Guide) (for PC) (5:23)
Use this tutorial for help with snipping, copying, and pasting
your data visualizations into your project template.
A captioned version of this video is available: How to Use the Snipping Tool (Beginner’s Guide) (CC) Video.
Resource: Is There a Snipping Tool
for Mac?
Use this tutorial for help with snipping, copying, and pasting your data visualizations into
your project template.
Resource: APA Style
Basics
Use this resource to support your in-line citations and full references in the References
section of your project template.
Introduction to ECO 201 8-1 Project Submission
This Owlisdom How-To Guide is designed to help you understand and apply critical microeconomic principles through simulation games. The eco 201 module 8 project involves engaging with several simulations that demonstrate real-world applications of these principles to enhance decision-making in business scenarios. By the end of this ECO 201 8-1 Project Submission guide, you will be able to draft a memorandum that effectively communicates the educational value and practical implications of microeconomic concepts.
You will receive a Project Template to solve the eco 201 module 8 project. I am using the SNHU template as an example.
You will need several simulation report images for your memorandum. All the necessary data visualizations will be generated after you have completed each simulation game. You must save image files of your simulation reports for your simulation discussions. These should also be used to create your memorandum report for the course project.
Simulation
To start the ECO 201 8-1 Project Submission, we will first play the simulations mentioned in previous modules and gather the result reports. We will solve the 8-1 Project according to our simulation findings.
- Simulation Report Images: After playing each simulation game, capture and save images of all the simulation reports. These images will be critical for your memorandum to support your discussions visually.
Comparative Advantage: Discuss the Comparative Advantage (With Trade) simulation you played in Module Two. You should add the Production Decisions graph and the Production Trade graph (i.e., the graph showing how many hamburgers per fries) from your simulation report into the project template as Figures 1.1 and 1.2. Then, answer the following questions in the paragraphs below the figures: How does this simulation demonstrate how individuals evaluate opportunity costs to make business decisions? Use the Production Decisions graph from the simulation as a reference to explain the role of the production-possibility frontier (PPF) in the decision-making process. Explain how comparative advantage impacts a firm’s decision to engage in trade. Would a business’s decision to trade cause a change to its PPF? Provide specific reasoning to support your claims.
Understanding Comparative Advantage
For the second section of ECO 201 8-1 Project Submission, we will discuss the comparative advantage.
- Play the Comparative Advantage Simulation: Focus on how different production choices affect opportunity costs and the production possibility frontier (PPF).
- Include Graphs in the Memorandum: Insert the Production Decisions and Production Trade graphs into your report as figures. These will visually support your analysis.
- Discuss Key Concepts: Explain how the simulation evaluates opportunity costs in business decisions and how comparative advantage influences trade decisions.
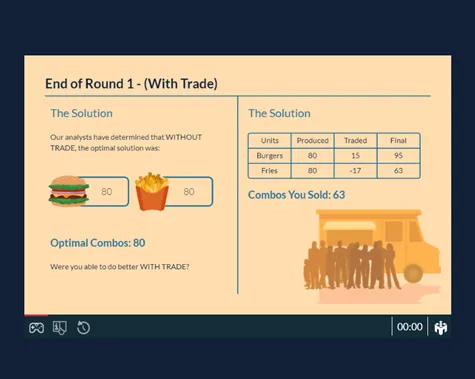

Example
Opportunity costs are the potential gains that a person, investor, or corporation forego while selecting one choice over another. Opportunity costs are invisible, making them easy to miss. Knowing the possibilities that may be lost when one investment choice is chosen over another is helpful to make more informed decisions. (Fernando, 2022). The opportunity cost is the gain that would have been obtained if a different alternative had been taken. To correctly assess opportunity costs, the costs and advantages of each possible choice must be analyzed and compared against one another. When making decisions for myself and my company, considering the worth of opportunity costs will help me make more beneficial decisions. Opportunity cost is an internal expense used for strategic planning; it is not included in accounting profit and is not reported externally. Opportunity cost may be seen in decisions like building a new factory in New York rather than Ohio, delaying an update to firm equipment, or selecting the most costly product packaging choice.
The principle of comparative advantage suggests that efforts should be concentrated where they will have the most impact. (Learn Economics, 2022). It refers to our capacity to generate something faster than others. It refers to the ability to create something with fewer resources. Let us imagine we are attempting to determine what to prepare for supper. Assume you are a good chef, and I am not. You are capable of making a more excellent steak than I am. This is referred to as your comparative advantage.
The production possibility frontier (PPF) is a graph curve that depicts the potential amounts of two goods if they rely on the same limited resources for manufacturing. (Bloomenthal, 2022). Moreover, PPF is quite essential in the realm of economics. For instance, it might show that a country’s economy has attained maximum achievable efficiency. Businesses and economists use the PPF to consider potential production scenarios by adjusting various resource factors. Companies might use the PPF to discover how factors affect production or to pick which items to develop. Economists may use it to determine how much of one product can be produced in a nation while not making another, allowing them to examine economic efficiency and growth.
Competitive Markets and Externalities: Discuss the Competitive Markets and Externalities simulations (both with and without policy interventions) that you played in Modules Three and Four. Add the Supply and Demand chart and the Outcomes by Market table from your simulation reports into the project template as Figures 2.1 and 2.2. Then, answer the following questions in the paragraphs below the figures: How do policy interventions affect a product’s supply and demand equilibrium? Provide specific examples from the simulation to illustrate. What are the determinants of price elasticity of demand? Identify at least three examples. Based on the outcome of the simulation, explain how price elasticity can impact pricing decisions and the firm’s total revenue. Based on the simulation results, can policy market interventions cause consumer or producer surplus? Explain why using specific reasoning.
Analyzing Competitive Markets and Externalities
Next, in ECO 201 8-1 Project Submission. We will analyze the market competitiveness and externalities.
- Engage with the Simulations on Competitive Markets and Externalities: Play both simulations to understand the effect of government policies on market equilibria.
- Visual Aids: Include the Supply and Demand chart and the Outcomes by Market table in your report.
- Address Specific Questions: Explore the impact of policy interventions on supply and demand, discuss the price elasticity of demand, and consider how market interventions might affect consumer and producer surplus.

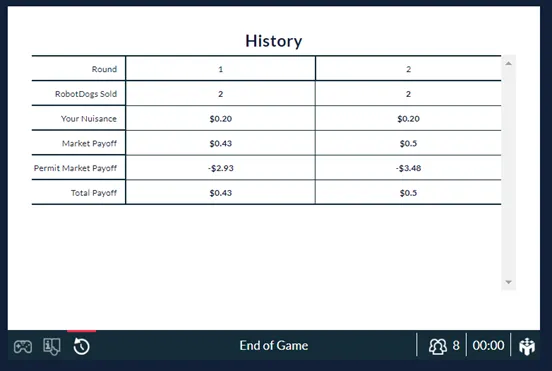
Example
When an externality causes a market failure and inefficient resource allocation, the government can take Command and Control (CAC) or market-based policies. (Mankiw, 2021). By contrast, market-based policies incentivize private decision-makers to address the issue independently, whereas CAC policies regulate conduct directly. Depending on the nature of the externality, CAC strategies may seek to incentivize or discourage particular actions. The government may implement a CAC approach in which the Environmental Protection Agency limits pollutants that businesses may release into the atmosphere. Because of this rule, companies must conduct themselves according to specific criteria. Examples of market-based policies include remedial taxes and subsidies and the ability to exchange pollution permits. (Bowles & Carlin, 2020). The usage of corrective taxes is one method that may be utilized to ensure that private decision-makers are aware of the societal costs that they need to consider in conjunction with the unfavorable externality. One illustration of this would be the Environmental Protection Agency’s ability to charge businesses a fee for each quantity of pollution such companies produce. Pollution licenses that may be bought and sold between businesses provide polluters a negotiating chip in the global war against pollution. If the Environmental Protection Agency determines that a firm can release a maximum of 500 tons of pollution per year but only emits 300, it can negotiate with another company to buy back the remaining 200 tons of dispersible pollution. The agreement benefits both businesses while maintaining compliance with the predetermined level of emissions that the Environmental Protection Agency had mandated.
Any time the government intervenes in the market using any of its powers, there are repercussions for the demand and supply equilibrium due to the resulting price shifts. When the government provides financial assistance to businesses, those businesses are more likely to reduce the prices at which they sell their products, which drives up consumer demand for those commodities. (Stansak, 2020). However, if the government levies taxes on manufactured products, it reduces consumers’ purchasing power, causing an imbalance corrected by the market’s supply and demand forces. Prices tend to rise if there is an imbalance between supply and demand and vice versa.
The simulation game illustrates how government intervention affects the market’s demand and supply equilibrium. Because of its interference, the costs of each unit in the game are reduced; as a result, it produces a situation in which the worth of the units either remains the same or increases. Consequently, it reduces the number of nuisances per individual at a lower cost. So, we can say that the units’ supply curve moves to the right, which means it goes up; since equilibrium prices stay the same or go down, equilibrium demand also goes up when the government intervenes to lower the cost of an item. Customers’ purchasing power increases, which in turn shifts the supply and demand balance.
Government action, in the form of taxes, can lead to a surplus for consumers and producers. The extent to which consumer and producer surplus is reduced due to taxes is more important than the amount of tax paid directly or indirectly—for example, imposing a milk tax of $1000 per gallon results in no new tax income since legal milk production is halted. However, the imposition of this tax results in significant economic damage in the form of a loss of surplus for both consumers and producers (Mankiw, 2021). Further, taxes lessen the overall volume of commerce, which cuts into earnings. When consumer prices are raised, there is a corresponding decline in consumer surplus. When prices are lowered for suppliers, there is a corresponding decline in producer surplus or profit. Additional government involvement that leads to surpluses for consumers and producers are price controls, price ceilings, and import tariffs.
Production, Entry, and Exit: Discuss the Production, Entry, and Exit simulation that you played in Module Five. Add the Aggregate Outcomes chart from your simulation report into the project template as Figure 3.1. Then, answer the following questions in the paragraphs below the figure: Analyze a business owner’s decision-making regarding whether to enter a market. For example, what factors determined the driver’s market entry and exit in the simulation? Use economic models to support your analysis. How does a business owner apply the concept of marginal costs to decide how much to produce? For example, how did the driver determine how many hours to drive each day? Use economic models to explain. How does the impact of fixed costs change production decisions in the short and long run? Use the average-total-cost (ATC) model included in the module reading chapters to demonstrate this impact.
Examining Production, Entry, and Exit
We will discuss the production, entry, and exit for the next part of the ECO 201 8-1 Project Submission.
- Simulation on Production Decisions: Understand factors influencing a business’s decision to enter or exit a market.
- Incorporate Aggregate Outcomes Chart: This will help explain economic models and their application to real-world scenarios.
- Analyze Key Decisions: Discuss how marginal and fixed costs influence production decisions.

Example
It was fun going through the simulation and seeing whether I could accurately forecast events and increase my earnings as a driver. My choice to drive was mainly influenced by the daily set charge, as well as the number of other people who were driving on that particular day. It would not be worth it to drive on a day when the hourly salary is predicted to be low since there would be too many drivers on the road. In other words, if there were more than five drivers, the set price would cause a loss in revenue.
As a company owner, one of the most important things to consider is the level of competition in the industry I am considering entering or leaving. The simulation demonstrates how the number of competitors that provide the same service or product as you may significantly impact your earnings—the greater the number of sellers, the lower the possible profit. In addition to this, the quantity of potential customers is also essential. You cannot make money if you do not have anyone to sell to. Because of this, the proportion of buyers to sellers in any market is a significant factor since it establishes the overall landscape of demand and supply in that particular market. (Fernando, 2021). It is profitable to join a market if the marginal cost matches the product’s value and is lower than the average cost at that quantity. On the other hand, if my company thinks that making a product will make less money than it costs to make, we will leave the market. In other words, the company is not profitable if the price of its product is lower than the average total cost of production.
The optimal output level for maximum profit is determined by marginal cost. (Mankiw, 2021). At this price, the marginal cost of producing the product is zero. If I were in charge of a company, I would research sales trends to determine how many units would need to be manufactured to cover overhead. To do so, I must assess my workforce requirements, calculate the square footage and equipment I will need to simulate a specific output and think about several ways to streamline production. I need these systems to function fully so my company can earn money.
Due to the need to sell more units of goods to break even, fixed expenses negatively influence short-term earnings. Each additional unit sold generates a more prominent profit once fixed expenses have been covered. Since fixed costs often have a lower margin of income with more significant production volumes, they favor production choices in the long term. In the early stages of a company’s development, for instance, it may invest in low-priced manufacturing equipment to generate enough revenue (profits) to cover expenses until the company can find its footing. When they have saved up enough money, they will invest in newer, more costly machinery, which will cost more initially but will save them money in the long run due to its reliability and productivity. Although this method may reduce earnings in the near term, it will boost profits in the long run as the enhanced production efficiency more than makes up for the higher initial investment in the more costly equipment.
Market Structures: Discuss the market structures simulations (Price Discrimination and Cournot) you played in Modules Six and Seven. Then, do the following in the project template: Complete Table 4.1 as a reference guide for your business partner. The table should compare the attributes of each of the four listed market structures. Answer the following questions in the paragraphs below the table: Explain what market inefficiencies derive from monopolies and monopolistic competition. Use examples from the textbook to support your claims. How do firms in an oligopolistic market set their prices? Use specific examples from the simulations or the textbook to support your claims. Explain how firms that compete in the four different market structures determine profitability. Use specific examples from the simulations or the textbook to support your claims.
Exploring Different Market Structures
For this section of ECO 201 8-1 Project Submission, we will discuss the different types of market structures.
- Study Different Market Simulations: Focus on the characteristics of perfect competition, monopolistic competition, monopoly, and oligopoly.
- Complete and Discuss Table 4.1: This table should outline the attributes of each market structure. Analyze how these structures affect pricing strategies and profitability.

Example
In monopolistic markets, when there are many sellers but few substitutes due to price, quality, and availability, we have imperfect or monopoly competition. In the monopoly game, one corporation takes the prices paid by its rivals as a given and ignores how its pricing decisions affect its competitors. (Mankiw, 2021). Monopolies retain their replacement capacity, unlike perfectly competitive markets. Industry models often make use of monopoly competition models. Restaurants, breakfast cereals, clothing, footwear, and urban service sectors are examples of monopoly-like market systems. Since monopolies do not have to compete with other producers on the market, they can always be efficient. Consider Facebook as an example. It is a monopoly as the dominant social media platform since no other services can compete on a level playing field. Due to the inevitable deadweight loss, it might also become ineffective. Because of the high pricing and little production, this has occurred. “Because a monopoly charges a price above marginal expense, not everyone who appreciates the commodity more than its cost buys it.”
There are two ways in which monopolistic competition might be ineffectual:
- If a company fails to create units that customers value more than the cost of production, it will charge a price that is more than its marginal cost.
- Many businesses are not using all of their manufacturing capacity since they have some spare capacity. As a result, output falls short of maximum power in monopolistic competition.
To a large extent, oligopolistic markets are characterized by the same essential characteristics. For starters, a few firms exert disproportionate market dominance. Only a few stores make up most of the industry’s retail establishments. The second distinguishing aspect of an oligopolistic market is the higher barriers to entry. (Mankiw, 2021). It is challenging to enter a well-established market due to the high startup costs and reduced competitive advantage you will have compared to well-established businesses. A distinguishing aspect of oligopolistic marketplaces is their interconnectedness. When one firm is affected by the price or promotional strategies of another, it is an example of interdependence. In oligopolistic markets, companies often do not decrease costs to gain a competitive edge.
When setting prices, oligopolists have to weigh the influence on production against the impact on pricing. When the price is greater than the marginal cost, the production effect of selling only one more gallon will enhance earnings. Water companies are raising output to boost total sales without sacrificing profit margins in response to the price changes. If the influence on output exceeds the effect on the price, the owner will increase production. If the impact on output is less than the price, the owner will not expand production.
Companies that operate in an oligopolistic fashion may be distinguished from monopolies by several key characteristics. Low levels of competition and considerable entrance obstacles characterize oligopolies. In contrast, monopolistic competition has many small enterprises offering similar or identical goods and services and unlimited entry and exit from the market. One definition of an oligopolistic market is one in which a small number of firms have a dominant influence. Few firms exert undue influence in their industry and those that do frequently work together for their benefit at the expense of consumers. The hotel business is an excellent example of monopolistic competition. There is much rivalry amongst these businesses, but they each have something unique to offer that makes them stand out.
The following five conditions define a market as perfect competition. To begin, the market is saturated with companies offering essentially the same service or product. Second, the companies are helpless as price takers because they cannot set prices. Third, since there are so many companies, no one has a dominant position in the market. As a fourth point, shoppers have full access to data on the market of products and their pricing. Getting into and out of the market is easy, which brings us to our fifth point. All companies eventually reach average earnings, and as a result, economic profits eventually fall to zero. The fast food sector is a good model of a market with perfect competition.
When companies offer comparable but not identical products or services, the market is said to have a monopolistic structure. All enterprises in this sector have relatively weak market power, and all market players share this weakness. There are few restrictions on who may enter or leave the market, and the actions of individual businesses have little impact on the actions of their competitors. Economic profit is zero in the long term. The hotel business is a typical monopolistic competition market.
Three key factors characterize an oligopoly market. In the first market, only a few companies had a decisive influence. As a second point, companies’ goods or services are similar but are significantly distinguished thanks to branding and marketing. Third, there are exit and entrance restrictions in the market. The actions of industry leaders profoundly influence competitors’ choices. When enterprises work together to establish prices at which MR>MC, they may realize economic gains, but in the event of a price war, they may see no gain. The telecommunications business is an excellent example of an oligopoly market.
There is just one company operating in a monopoly market. Company X is the only provider of Product Y. It is difficult for new companies to enter the market, giving the dominant one significant competition. By pricing its offerings at a level where MC>MR, the company ensures that it will have long-term financial success. When the government licenses a monopoly to produce and sell a product, it locks out all other competitors for 17 years under patent protection. Therefore, the company may increase its prices and reap substantial economic benefits. Governments provide market protection to incentivize innovation and introduce new items to consumers.
Conclusions: Draw your overall conclusions about the relevance and significance of microeconomics. How will microeconomics principles impact your business decisions moving forward? Provide recommendations to your business partner for your future business venture.
Drawing Conclusions and Applying Principles
For the last part of the ECO 201 8-1 Project Submission, we will summarize the findings and provide conclusions by applying the learned principles.
- Synthesize Learning: Reflect on how the simulations illustrate microeconomic principles and their relevance to business decisions.
- Provide Practical Recommendations: Offer actionable advice based on your findings to assist your business partner in making informed decisions.
Example
Microeconomics applies basic concepts to foretell how individuals will act in certain situations, especially those involving economic or monetary transactions. These norms consider utility amplification, opportunity costs, and the rule of market interest. Moreover, corporations and other organizations may benefit from microeconomics.
We would form a fantastic team, and I am optimistic about our company’s prospects if you would take the time to study all this microeconomics material and better grasp its importance.
Closing
By following this How-To Guide, you will be equipped to create a comprehensive memorandum that effectively communicates the relevance of microeconomics to real-world business applications. This guide will equip you with the necessary guidelines in preparing them for thoughtful and strategic entrepreneurial activities to solve the ECO 201 8-1 Project Submission. You can also read our ECO 201 next module, 8-2 Discussions on Frontiers of Microeconomics.
References
Bloomenthal, A. (2022, August 17). Production Possibility Frontier (PPF): Purpose and Use in Economics. Investopedia. https://www.investopedia.com/terms/p/productionpossibilityfrontier.asp
Bowles, S., & Carlin, W. (2020). What Students Learn in Economics 101: Time for a Change. Journal of Economic Literature, 58(1), 176–214. https://doi.org/10.1257/jel.20191585
Fernando, J. (2021, November 7). Law of Supply and Demand in Economics: How It Works. Investopedia. https://www.investopedia.com/terms/l/law-of-supply-demand.asp
Fernando, J. (2022, June 27). Opportunity Cost Formula, Calculation, and What It Can Tell You. Investopedia. https://www.investopedia.com/terms/o/opportunitycost.asp
Learn Economics: The Law of Comparative Advantage – 2022. (2022, October 13). MasterClass. https://www.masterclass.com/articles/learn-economics-the-law-of-comparative-advantage
Mankiw, N. G. (2021). Principles of Economics (9th edition). Cengage Learning, Inc.
Stansak, J. (2020, November 15). The Effects of Government Intervention in Markets | Fiveable. https://library.fiveable.me
ECO 201 8-2 DISCUSSIONS: Frontiers of Microeconomics
Instructions for ECO 201 8-2 Discussions
Economic behavior is more complex than assumed by conventional economic theory. Political economy explains the functioning of government. Behavioral economics ties psychology to human behavior.
Economists assume that individuals make rational decisions. However, real people are more complex.
Based on what you have learned in your assigned reading, answer the following questions in your initial post:
- What are the human behaviors economists should observe when creating economic models? For example, people tend to find solutions that are good enough, but not the best solutions.
In your responses, comment on at least two of your peers’ posts and share an example of how non-rational human behavior can change an economic outcome.
To complete this assignment, review the Module Eight Discussion Rubric.
Introduction to ECO 201 8-2 Discussion
This Owlisdom How-To Guide aims to assist you in tackling questions related to the complexities of economic behavior and the fundamentals of behavioral economics. The guide outlines steps to approach these topics effectively, enhancing understanding and applying the concepts discussed in readings on behavioral economics, rationality, and irrational choices to solve ECO 201 8-2 Discussions: Frontiers of Microeconomics.
What are the human behaviors economists should observe when creating economic models? For example, people tend to find solutions that are good enough but not the best solutions.
Exploring Behavioral Economics
We will explore behavioral economics to start the ECO 201 8-2 Discussions: Frontiers of Microeconomics.
- Define Behavioral Economics: Behavioral economics as the study of psychological influences on the economic decisions of individuals and institutions.
- Importance of Study: Stress why understanding behavioral economics is crucial for developing accurate economic models.
Example
Studying behavioral economics should come first; then, we can develop economic models, whether visual, mathematical, or simulation-based.
Behavioral economics research examines how psychological concepts are applied to people’s and organizations’ economic decision-making processes. (Samson, 2022). In an ideal world, people would choose the decision that would result in the most significant number of advantages and happiness levels; unfortunately, this is not the case in the real world. Rationality is the aspect of conduct that should be examined with the utmost priority. Rationality is essential for making reasonable and logical judgments; nonetheless, people often make decisions based on impulses and feelings rather than rational considerations. It has also been proven via the sound choice theory that when people are confronted with alternatives in times of scarcity, they generally pick the one that favors their own needs and desires as individuals.
Another tendency to keep an eye out for is the reasons why individuals make illogical choices. Irrational choices result in behavior that does not reflect the predictions given by economic models when such decisions are implemented. The field of behavioral economics investigates the reasons why individuals make the choices they do. For instance, why do people choose a big coffee over a small one, or how much money are they willing to spend on an ice cream cone?
Another habit of checking is whether someone is making choices in their best interest. Behavioral economists demonstrate that cognitive bias, social factors, and emotional states influence individuals’ preferences. When people act rashly and emotionally when they make judgments, economic models are sometimes rendered less effective or impossible to complete.
In your responses, comment on at least two of your peers’ posts and share an example of how non-rational human behavior can change an economic outcome.
Peer Responses
Responding to peers is one of the vital parts of the ECO 201 8-2 Discussions: Frontiers of Microeconomics posts. We need to provide at least two peer responses. I will provide one example post. You can write your peer responses by keeping the following points in mind.
- Encouragement of Engagement: Guide students on effectively engaging with peers’ posts, suggesting they share examples of non-rational behaviors affecting economic outcomes.
- Examples to Consider: Offer ideas such as panic buying or herd behavior in financial markets as discussion points.
Response 01
Hey Sam! You’ve made some compelling points about the importance of behavioral economics in understanding non-rational decision-making. It’s fascinating how emotions and biases can lead to economic outcomes different from what traditional models predict. For instance, during the stock market crash in 2008, panic and fear drove many investors to sell their stocks at low prices, significantly worsening the market’s downturn. This behavior starkly contrasts with the rational decision-making expected in economic models, highlighting how psychological factors can profoundly impact economic stability (Mankiw et al., 2021).
Response 02
I have addressed the given instructions in one response. Following these instructions, you can quickly write your peer responses to ECO 201 8-2 Discussions: Frontiers of Microeconomics without a hassle.
Closing
By following this ECO 201 8-2 Discussions: Frontiers of Microeconomics guide, students will be better prepared to discuss and analyze the nuances of economic behavior in a structured and insightful manner, enriching their understanding and application of financial theories in real-world scenarios.
References
Samson, A. (2022). An Introduction to Behavioral Economics. BehavioralEconomics.Com | The BE Hub. https://www.behavioraleconomics.com/resources/introduction-behavioral-economics
Mandler, T., Sezen, B., Chen, J., & Özsomer, A. (2021). Performance consequences of marketing standardization/adaptation: A systematic literature review and future research agenda. Journal of Business Research, 125, 416–435. https://doi.org/10.1016/j.jbusres.2020.12.023