

BUS 225 1-1 Assignment Guide: Critical Thinking for Business Decisions
Published: 2025-09-30
Modified: 2025-09-30
Table of Contents
Introduction
This guide helps BUS 225 students practice critical thinking by analyzing Disney’s diversification and showing how logic, evidence, and data shape business decisions. It also connects the steps from analysis to professional presentation. For more structured support, explore Owlisdom’s MBA Assignment Help.
BUS 225 1-1 assignment: critical thinking for business decisions
Instructions for BUS 225 1-1 assignment
Assignment: Critical Thinking for Business Decisions
Overview
Business leaders are often faced with situations that require swift but responsible decisions. You’ve learned how critical thinking is more than simply evaluating the pros and cons of a situation. It is a method that engages broad thinking abilities that include brainstorming, data analysis, creativity, collaboration, and reflection. The ability to adapt to ever-changing conditions through critical thinking and decision-making is key to capitalizing on market upturns and staying afloat during economic declines.
As part of this course, you will complete a series of assignments.
Prompt
For this assignment, analyze the diversification strategy of either Disney or Kimberly-Clark using the documents linked within your Soomo webtext.
Explain how critical thinking applies to decision-making based on your review of a real-world scenario. Specifically, you must address the following rubric criteria:
- Application: Explain how critical thinking for decision-making applies to the scenario. Use evidence to support
your explanations.
- What makes critical thinking crucial for decision-making?
- Analysis: Explain how information (such as facts, opinions, and published reports) is used to determine or
establish the context. Use evidence to support your explanations.
- Why do you think the company decided to diversify?
- What steps do you believe were taken? Explain your response using sources found during the research of your selected company.
- Conclusion and related outcomes: Describe the role of logic, evidence, and arguments in the company’s
decision-making process.
- Was the decision to expand products, services, or the value chain successful? Why or why not?
To begin, choose one of the following to focus on for this assignment and review the corresponding document provided in the Soomo webtext.
- Kimberly-Clark
- Disney
Guidelines for Submission
Complete the Critical Thinking for Business Decisions worksheet in your Soomo webtext, download your completed work, and submit it in Brightspace for instructor feedback.
You should write using a professional voice, and any sources should be cited according to APA style. Your assignment must be between 400 and 800 words in length.
Introduction to BUS 225 1-1 Assignment
Welcome to the BUS 225 1-1 assignment: critical thinking for business decisions. This How-To Guide revolves around your understanding of Critical Thinking for Business. I will provide brief and descriptive guidelines to solve the 1-1 Assignment post and a dummy solution for each section. This Owlisdom How-To Guide will equip you with guidelines to tackle all the queries related to the BUS 225 1-1 assignment: critical thinking for business decisions post. Let us begin with the guide.
Analyze the diversification strategy of either Disney. Explain how critical thinking applies to decision-making based on your review of a real-world scenario.
Introduction
For the BUS 225 1-1 assignment: critical thinking for business decisions, I have selected Disney. Keeping this in mind, we have to briefly introduce Disney and highlight the role of Critical Thinking in decision-making.
- Briefly describe Disney’s diversification strategy. This could include expansion into different entertainment mediums, geographical expansion, acquisition of other companies, etc.
- Highlight the role of critical thinking in decision-making. Mention why evaluating various factors beyond pros and cons is essential in complex business environments.
Example
Disney, a global leader in entertainment, has skillfully executed a diversification strategy that spans various media and markets. This strategy includes venturing into television, theme parks, digital platforms, and international expansions and acquiring other entertainment entities like Pixar, Marvel, and Lucasfilm (Symes et al., 2017). Such moves broadened Disney’s portfolio and fortified its market position across different demographics and geographies.
Critical thinking has played a pivotal role in Disney’s decision-making process, enabling the company to navigate complex business environments successfully. By evaluating factors beyond simple pros and cons—such as potential long-term market trends, cultural shifts, and technological advancements—Disney has made informed decisions that capitalize on emerging opportunities and mitigate risks(Grenier & Kaeppel, 2023). This approach underscores the importance of a nuanced analysis that includes brainstorming, data examination, creativity, and strategic foresight, which is essential for thriving in today’s dynamic business landscape.
Explain how critical thinking for decision-making applies to the scenario. Use evidence to support your explanations.
What makes critical thinking crucial for decision-making?
Application
For this section of BUS 225 1-1 assignment, critical thinking for business decisions, we must explain the application of critical thinking in decision-making.
- Explain the application of critical thinking. Discuss how critical thinking skills such as analysis, evaluation, and reflection might have been applied in Disney’s decision to diversify.
- Illustrate your points using specific examples or hypothetical scenarios based on Disney’s history.
- Support your explanation with evidence. Refer to specific instances within the linked documents or credible sources that indicate using critical thinking in decision-making.
Example
In the strategic diversification of Disney, critical thinking was paramount, involving rigorous analysis, evaluation, and reflection (Santiago & Skov-Carlsen, n.d.). For instance, Disney’s acquisition of Pixar, Marvel, and Lucasfilm showcases an application of critical thinking in identifying synergies that could expand its market reach and content library. Disney evaluated the potential for these companies to enrich its storytelling capabilities and appeal to wider audiences, thus securing a competitive advantage in the entertainment industry.
The decision to diversify into streaming services with Disney+ is another example of critical thinking in action. Disney analyzed the shifting consumer preferences toward digital content consumption and evaluated the long-term benefits of owning a direct-to-consumer platform (Mulla, 2022). This move required reflecting on the company’s core competencies in content creation and leveraging them in a new, rapidly growing distribution channel.
These decisions underscore the critical role of thinking beyond immediate gains, focusing on sustainable growth and adaptation to technological advancements and changing market dynamics.
Explain how information (such as facts, opinions, and published reports) determines or establishes the context. Use evidence to support your explanations.
What steps do you believe were taken? Explain your response using sources found during your research on your selected company.
Analysis
For the analysis of the BUS 225 1-1 assignment, critical thinking for business decisions, we will discuss different sources and use them to justify our comments.
- Analyze the information used for decision-making. Detail how Disney might have used facts, opinions, and published reports to shape their diversification strategy.
- This could include market analysis, consumer behavior studies, and financial forecasts.
- Discuss the company’s decision to diversify. Based on your analysis, infer why Disney decided to diversify.
- Consider economic, competitive, and strategic factors.
- Outline the presumed steps taken. Speculate the sequence of actions or decisions Disney made in its diversification process.
- Support your reasoning with research, pointing to similar decisions made in the business world as examples.
Example
Disney’s decision to diversify its business operations was driven by a comprehensive analysis of market trends, consumer behavior studies, and financial forecasts, utilizing facts, expert opinions, and industry reports (Santiago & Skov-Carlsen, n.d.). The strategic move towards acquiring major content creators like Pixar, Marvel, and Lucasfilm was influenced by the need to stay competitive in a rapidly evolving entertainment landscape and to cater to a broader audience with varied interests.
Economic factors, such as the rising demand for digital content and the shift towards streaming platforms, played a significant role. Disney recognized these trends and launched Disney+, a direct-to-consumer streaming service, to capture the growing online viewership and ensure a direct relationship with its consumers (Soares et al., 2022)
Strategically, Disney’s diversification can be seen as steps to mitigate risks associated with over-reliance on traditional revenue streams and to explore new growth avenues in content creation, distribution, and technology. The company likely conducted an in-depth market analysis, evaluated potential acquisitions for synergy, and planned for an integrated approach to content distribution across its platforms.
Describe the role of logic, evidence, and arguments in the company’s decision-making process.
Was the decision to expand products, services, or the value chain successful? Why or why not?
Conclusion
In conclusion of BUS 225 1-1 assignment: critical thinking for business decisions, we will summarize all the key takeaways.
- Describe the role of logic, evidence, and arguments.
- Summarize how these elements were crucial in Disney’s decision-making process. Emphasize the importance of a well-reasoned approach backed by solid evidence.
- Evaluate the success of the diversification. Assess whether Disney’s strategy to expand products, services, or its value chain was successful.
- Provide reasons for your conclusion, including financial performance, market share growth, or enhanced brand value.
Example
Disney’s decision-making process is epitomized by a reliance on logic, evidence, and sound arguments, crucial for its successful diversification. This methodical approach, grounded in market analysis, consumer insights, and financial projections, enabled strategic decisions like acquiring major studios and launching Disney+ (Soares et al., 2022). The outcome of these strategies is a testament to Disney’s success, which is reflected in Disney’s improved financial performance, market share expansion, and increased brand value. The launch of Disney+, alongside acquisitions such as Pixar, Marvel, and Lucasfilm, diversified Disney’s audience and content, enhancing its competitive edge and resilience in the market. This well-reasoned, evidence-based strategy underscores Disney’s leadership in the entertainment industry and its ability to thrive amid evolving market dynamics.
Closing
By following this BUS 225 1-1 assignment: Critical Thinking for Business Decisions guide, you can construct a
well-organized and insightful analysis of Disney’s diversification strategy through the lens of critical
thinking and decision-making.
In the next module of BUS-225, we will explore the 1-2 Discussion on Research and
Problem Solving.
References
Grenier, R. S., & Kaeppel, K. (2023). Challenging Dominant Ideologies and Expanding the Narrative Habitus in Organizing Spaces Through Critical Thinking. In J. C. Collins & J. L. Callahan (Eds.), The Palgrave Handbook of Critical Human Resource Development (pp. 201–218). Springer International Publishing. https://doi.org/10.1007/978-3-031-10453-4_12
Mulla, T. (2022). Assessing the factors influencing the adoption of over-the-top streaming platforms: A literature review from 2007 to 2021. Telematics and Informatics, p. 69, 101797.
Santiago, L., & Skov-Carlsen, M. (n.d.). Integrated Strategy Project (ISP).
Soares, D., Freitas, H., Oliveira, J., Vieira, L., & Au-Yong-Oliveira, M. (2022). Keeping the Eyes Busy: A Case Study of Disney+. World Conference on Information Systems and Technologies, 195–206.
Symes, H., Sharma, U., & Davey, H. (2017). The impact of accounting regulations on annual report length. International Journal of Economics and Accounting, 8(3–4), pp. 275–302. https://doi.org/10.1504/IJEA.2017.092278
BUS 225 1-2 Discussion: Research and Problem Solving
Instructions for BUS 225 1-2 Discussion
Discussion
In our society, we must develop the ability to understand context and problem-solve, whether it’s for civic or professional reasons. This is true for leaders at all levels, from those in charge of diverse industries to politicians and lobbyists. The research process is one fundamental practice that ensures individuals can develop, express, and justify solutions.
In your initial post, briefly introduce yourself to your peers. Then, briefly describe a problem that you or a group of people you belong to are currently experiencing. Explain the main characteristics of the problem, the obstacles you face in getting it solved, and your goal. Then, address the following:
- How would you solve the problem?
- What research and resources will you need to solve it?
- How would you justify your solution?
In response to at least two of your peers, address the following:
- What ideas or resources can you share to help your peers craft their solutions?
- What are some obstacles to your peers’ potential solutions?
Introduction to BUS 225 1-2 Discussion
BUS 225 1-2 Discussion explores how research helps in financial problem-solving. This Owlisdom How-To Guide will discuss the guidelines for solving the BUS 225 1-2 Discussion: Research and Problem Solving post.
Briefly introduce yourself to your peers. Then, briefly describe a problem that you or a group of people you belong to are currently experiencing.
Understanding the Problem
To start with the BUS 225 1-2 Discussion: Research and Problem-Solving post, introduce yourself briefly and then discuss understanding a financial problem.
- Financial problems often involve unexpected expenses, revenue fluctuations, and difficulty accessing credit.
- Key obstacles include a need for real-time financial data, unpredictable market conditions, and limited financial literacy.
- The main goal is a stable cash flow supporting current operations and expansion plans.
Example
I am a Business Finance student eager to dive into our discussions. Understanding financial problems means recognizing their core components: unexpected costs, revenue swings, and credit access issues. We tackle these by first identifying the specifics of each challenge. For instance, unexpected expenses can arise from emergency repairs or sudden market shifts. Cloud-based financial tracking provides current data to navigate these waters (Ikegwu et al., 2022). Education on financial fundamentals enhances our ability to plan and respond effectively. Ultimately, we aim to establish a cash flow that keeps the lights on today and paves the way for future growth, ensuring a stable and prosperous path.
What research and resources will you need to solve it?
Solving the Problem
After understanding the problem, in this section of the BUS 225 1-2 Discussion: Research and Problem Solving, we will explore how we can solve the problem.
- Utilize budgeting tools, improve invoicing processes, and explore financing options.
- This involves researching financial management software, understanding different types of loans, and consulting with financial advisors.
Example
The plan involves a few key steps to solve our financial challenges. First, adopting budgeting tools helps track and manage expenses against revenue, preventing overspending. Enhancing our invoicing processes ensures faster client payments, improving cash flow(Sanchez & Rodriguez, 2020). Research is essential here: we would explore various financial management software to find the best fit for our needs, offering real-time insights into our finances. Understanding different loan options and when to use them can bridge gaps during tight cash flow periods (Novikova, 2022). Lastly, consulting with financial advisors can provide personalized strategies to navigate our specific obstacles. By leveraging these resources, we aim to build a more resilient and financially stable operation.
How would you justify your solution?
Justifying the Solution
In this section of the BUS 225 1-2 Discussion: Research and Problem Solving, we need to justify the solution we suggested in the previous section.
- A solution is justifiable if it increases cash flow stability, is cost-effective, and supports long-term growth.
- Justify your solution by demonstrating its potential return on investment (ROI) and how it addresses the identified obstacles.
Example
Our proposed solution stands strong because it directly targets the root causes of our financial challenges, ensuring long-term stability and growth. By implementing budgeting tools and improving invoicing, we cut costs and optimize our cash flow to be more predictable and robust against unforeseen expenses. The return on investment (ROI) from adopting financial management software is clear: less time spent on manual data entry and more accurate financial forecasting (Polak et al., 2020). Consulting with financial advisors tailors our strategy to our unique situation, maximizing our growth potential. Each step of our solution addresses our identified obstacles head-on, making it a practical, cost-effective strategy for achieving financial stability and fostering growth.
What are some obstacles to your peers’ potential solutions?
Responding to Peers
Responding to peers is one of the vital parts of the BUS 225 1-2 Discussion post. For this discussion, we need two or more response posts. I will provide an example response and the guidelines for writing a peer response for the BUS 225 1-2 Discussion: Research and Problem Solving.
- I recommend exploring cloud-based accounting software for real-time financial data and considering short-term financing options like lines of credit for immediate cash flow needs.
- One common obstacle might be the reluctance to adopt new technologies or processes. It is essential to highlight the long-term benefits and provide training or support to ease the transition.
Response 01
Great insight into the challenges of market analysis for startups! Consider looking into digital tools for market trend analytics and competitor analysis. These can offer valuable insights without the need for extensive market research teams. The initial cost might be a potential obstacle, but the long-term benefits of informed decision-making can outweigh these costs.
Closing
This BUS 225 1-2 Discussion: Research and Problem Solving guide is completed. In the next module of BUS-225, we will explore the 2-1 Assignment: Making Difficult Decisions Using Data.
BUS 225 2-1 assignment: making difficult decisions using data
Instructions for BUS 225 2-1 assignment
Overview
Company leaders need to keep a watchful eye on the economy and how micro- and macro-environments affect their businesses. Successful leaders are always a step ahead. They stay there by leading with data-driven decisions that allow their companies to anticipate and respond to challenges. In this module, you’ve learned how information is key to making decisions and solving problems; however, research and analytical skills are also needed to extract value from data. Information-gathering should align with research objectives. Qualitative and quantitative data, along with relevant and credible primary and secondary sources, are fundamental ingredients for informing good judgment.
Prompt
In a report by the U.S. Department of Commerce, the U.S. economy contracted at an annual rate of 4.8% in the first quarter of this year. For this assignment, you will take on the role of an HR manager at an air transportation supply company. The company is currently struggling with a significant loss of revenue and is considering operational costs. You have been asked to analyze employee performance over the last year and make sense of the data.
Using a summary (provided below) of the company’s employee salaries, bonuses, and performance data, address the following rubric criteria:
- Interpretation: Discuss your interpretation of the data.
- What questions emerge from your analysis of the data?
- What story can they tell about the company’s employees?
- Analysis: Explain how the provided data helps you understand your employees and how the company
is using its financial resources. Identify potential gaps or issues in the data.
- What is the quantitative and qualitative data telling you? Are there any underlying issues or perspectives?
- What is the data not telling you?
- What additional primary and secondary sources would help the company make a decision?
- Conclusion and related outcomes: Describe how you have used data to determine a strategy. Use
evidence to support your explanations.
- What would your strategy be if you were asked to recommend a 10% reduction in the budget?
- How would you synthesize and defend your decision-making process?
This resource will assist you as you complete your paper.
- Air Transportation Supplier HR Performance Data Spreadsheet. This summary table of your company’s HR performance data will inform your work on this assignment.
Guidelines for Submission
Complete the Making Decisions and Overcoming Bias Using Research worksheet in your Soomo webtext, download your completed work, and submit it in Brightspace for instructor feedback. You should write using a professional voice, and any sources should be cited according to APA style. Your assignment must be between 400 and 800 words in length.
Introduction to 2-1 assignment: making difficult decisions using data
In the BUS 225 2-1 Assignment, you will analyse employee performance and economic data as an HR manager of an air transportation supply company facing significant financial challenges. The BUS 225 2-1 assignment: making difficult decisions using data requires critical thinking and a strategic approach to extract meaningful insights from data, helping you make informed decisions to guide your company through difficult times.
Due to confidentiality, I will call the Air Transportation Supply Company “XYZ.”
What questions emerge from your analysis of the data?
What story can they tell about the company’s employees?
Data Interpretation
To start the BUS 225 2-1 assignment: making difficult decisions using data, we will analyse and interpret the company’s data spreadsheet.
- Look for patterns or anomalies in the data. What does a low or high-performance score indicate under current company conditions?
- Use the data to narrate how employee performance might impact the company’s financial health—link performance scores with managerial comments and departmental outcomes.
Example
Analysing the employee performance data reveals a clear correlation between performance scores, managerial commentary, and departmental financial allocations. Low-performance scores, particularly in departments like Account Planning and HR & Facilities, often align with critical managerial remarks such as “Needs motivation.” In contrast, higher scores in departments like Manufacturing and Sales coincide with positive feedback and essential employee recognition, indicating robust productivity and potentially more significant contributions to financial stability.
Emerging questions include: What causes variability in performance across departments? Could targeted interventions in training or management improve low scores and financial outcomes?
The narrative from this data suggests that enhancing employee performance through strategic HR interventions could positively impact the company’s financial health. Departments with consistently high-performance scores might leverage practices mirrored in underperforming areas to improve overall company performance and reduce operational costs.
Please explain how the provided data helps you understand your employees and how the company uses its financial resources. Identify potential gaps or issues in the data.
What is the data not telling you? What additional primary and secondary sources would help the company make a decision?
Data Analysis
We will explain the analysed data in the next section of the BUS 225 2-1 assignment: making difficult decisions using data. We will discuss how the data explains the employees and resources of the company.
- Understanding Quantitative and Qualitative Insights: Analyze the scores and feedback to gauge departmental and individual performance levels. Consider both numerical data and textual comments for a holistic view.
- Identifying Data Gaps: Assess missing information that could aid a more thorough analysis (e.g., employee satisfaction, turnover rates).
- Integrating Additional Sources: Consider how external data (market trends, economic reports) or internal reports (previous years’ performance metrics) could complement your analysis.
Example
The data provided insights into employee performance and financial resource allocation, indicating potential inefficiencies. Quantitatively, varying performance scores across departments suggest discrepancies in employee productivity. Qualitatively, managerial comments enrich these metrics by highlighting behavioural trends and individual contributions, which could influence financial allocations to departments like Manufacturing, which shows higher productivity. However, the data lacks indicators of employee satisfaction or turnover rates, which are critical for a comprehensive analysis.
Further, the absence of comparative historical performance data and external benchmarks limits the strategic understanding of trends over time. The company would benefit from integrating additional primary sources, like employee surveys, and secondary sources, such as industry benchmarks or economic reports, to make informed decisions. These would provide a broader context, allowing for a deeper understanding of how internal capabilities align with market dynamics, echoing how the liberal arts have evolved to incorporate broader interdisciplinary insights into human behaviours and societal trends.
Describe how you have used data to determine a strategy. Use evidence to support your explanations.
How would you synthesise and defend your decision process?
Formulating Conclusions and Strategy
For the last section of the BUS 225 2-1 assignment: making difficult decisions using data, we will conclude our analysis and provide a strategy to determine the data.
- Data-Driven Decision Making: Use the insights gained to formulate actionable strategies. How can the data inform cost-cutting measures or reallocations?
- Strategy Recommendation for Budget Reduction: Propose a strategy to reduce the budget by 10%. Consider areas where performance is low and costs are high.
- Synthesising and Defending Decisions: Prepare to defend your strategy by synthesising data and insights into a compelling rationale.
Example
Utilising the provided data, the strategy for a 10% budget reduction focuses on departments with lower performance scores and higher operational costs, as indicated by the data analysis. For instance, reallocating resources from underperforming departments like Account Planning, which combines lower scores and less critical feedback, could optimise financial efficiency. The decision process integrates quantitative (performance scores, salary allocations) and qualitative data (managerial comments), supporting a balanced view of operational effectiveness.
In defending this strategy, I would emphasise the alignment of financial resources with demonstrated productivity and essential roles within the company, ensuring that cuts are data-informed and strategically sound. This approach not only reflects modern interdisciplinary insights typical of the evolved liberal arts perspective but also provides a robust, holistic understanding of business needs and human factors.
Closing
The BUS 225 2-1 assignment: making difficult decisions using data can identify critical areas of improvement and
potential savings for the company by systematically analysing employee performance data. This Owlisdom How-To Guide will highlight the importance of data in strategic
decision-making and reinforce the need for continual assessment and adjustment of strategies based on analytical
findings.
In the next module of BUS-225, we will explore the 2-2 Discussion: Making Decisions and Overcoming
Bias Using.
BUS 225 2-2 Discussion: Making Decisions and Overcoming Bias Using Research
Instructions for BUS 225 2-2 Discussion
Discussion
For this discussion, imagine you’ve taken on the role of a manager at an engineering company. You’ve been approached by a supplier of goods—one you haven’t worked with before. The supplier shows you the new software package it is launching in a few months, and it piques your interest. The demo of the new technology shows you how it could really help your team design and develop projects faster. It also includes many add-ons for items that your company is not currently working on, but that your intuition says it should be.
The supplier’s study says that 90 percent of your industry will be transitioning to this new technology in a couple of years, and that if your company doesn’t move forward with it, you will fall behind. You are eager to grow revenue, develop your team, and wow your clients. The supplier says it is not making the new technology available to your competitors because it would prefer to partner with a prestigious company like yours. You think the supplier’s representative is knowledgeable about the new technology and your industry, and you enjoy the conversations you’ve had, but you still feel uneasy about deciding on whether to partner with this new supplier.
In your initial post, address the following:
- What research steps need to be taken before you can make a decision?
- How would you use qualitative or quantitative data to help you make a decision? Explain the difference between these two methods.
- How would you use primary and secondary sources to support your decision? Explain the difference between these two source types.
In response to at least two of your peers, address the following:
- Can you spot bias or illogical, or unethical arguments in your peer’s initial post? Explain your response and give examples.
To complete this assignment, review the Discussion Rubric.
Introduction to BUS 225 2-2 Discussion
This discussion post revolves around your understanding of decision-making and overcoming bias using research. I will provide brief and descriptive guidelines to solve the BUS 225 2-2 Discussion: Making Decisions and Overcoming Bias Using Research post and a dummy solution for each section. This Owlisdom How-To Guide will equip you with guidelines to tackle all the queries related to the bus 225 discussion 2 post. Let us begin with the guide.
Introduction to the Scenario
We will briefly introduce the scenario to start the BUS 225 2-2 Discussion: Making Decisions and Overcoming Bias Using Research.
- Introduce the context of being a manager at an engineering company faced with a decision regarding a new supplier’s software package.
- Summarise the scenario, highlighting the potential benefits and concerns associated with the new technology and the decision to be made.
Example
As a manager at an engineering firm, I am evaluating a new supplier’s software that promises to enhance our project development speed. While it is enticing as it aligns with industry trends and potential expansion areas, concerns about its novelty, exclusive supplier terms, and our readiness for technological adoption necessitate careful decision-making.
What research steps need to be place before you can make a decision?
Research Steps Before Decision-Making
For this section of BUS 225 2-2 Discussion: Making Decisions and Overcoming Bias Using Research, we will discuss the necessary steps to take before decision-making. We will identify the research steps needed to decide on partnering with the new supplier.
- Market Analysis: Conduct an industry-wide analysis to verify the claim that 90% of the industry will transition to this new technology.
- Competitor Analysis: Understand competitors’ technologies and whether they plan to switch.
- Supplier Background Check: Research the supplier’s history, reputation, and reliability.
- Technology Evaluation: Assess the software’s compatibility with current systems and scalability for future needs.
- Cost-Benefit Analysis: Compare the costs of adopting the new technology against the projected benefits and revenue growth.
Example
Before deciding to partner with the new supplier, we must undertake a thorough research process. First, a market analysis is necessary to verify the supplier’s claim that 90% of the industry will adopt this new technology, ensuring our move aligns with broader industry trends (Wang et al., 2020). Next, a competitor analysis will help us understand the technologies currently employed by our competitors and their plans for future upgrades. Additionally, a background check on the supplier will provide insights into their reliability and reputation. We must also evaluate the software’s compatibility with our current systems and its potential for future scalability. Finally, a cost-benefit analysis will compare the financial investment required against the projected benefits and revenue growth, helping us to make an informed decision (Mishan & Quah, 2020).
How would you use qualitative or quantitative data to help you decide? Explain the difference between these two methods.
Utilising Qualitative and Quantitative Data
For the next section of the BUS 225 2-2 Discussion: Making Decisions and Overcoming Bias Using Research, we will explain how both qualitative and quantitative data can assist in making a decision.
- Qualitative Data: Gather opinions and feedback from your team and industry experts about the software’s potential impact on workflow and innovation.
- Quantitative Data: Look at statistical data, such as projected return on investment (ROI), market trends, and the technology’s adoption rate within the industry.
- Difference Explanation: Highlight the difference between qualitative data (non-numerical insights and opinions) and quantitative data (numerical data and statistics).
Example
Qualitative and quantitative data are invaluable in making an informed decision about the new software. Qualitative data involves gathering insights from team members and industry experts to understand the potential impact of the software on our workflow and innovation (Muhammad, 2021). On the other hand, quantitative data involves analysing numerical statistics such as projected ROI, market trends, and adoption rates within the industry. The critical difference lies in the data: qualitative data offers subjective perspectives and insights, whereas quantitative data provides objective, numerical evidence that can be statistically analysed.
How would you use primary and secondary sources to support your decision? Explain the difference between these two source types.
Leveraging Primary and Secondary Sources
In this section of BUS 225 2-2 Discussion: Making Decisions and Overcoming Bias Using Research. We will describe using primary and secondary sources to support the decision-making process.
- Primary Sources: Direct information from the supplier, including demonstrations, technical specifications, and pilot testing results.
- Secondary Sources: Independent reviews, industry reports, competitor announcements, and academic studies on similar technology adoptions.
- Source Types Explanation: Clarify that primary sources offer direct evidence or first-hand accounts, while secondary sources involve analysing, interpreting, or synthesising primary source information.
Example
In the decision-making process for adopting new technology, utilising both primary and secondary sources is crucial (Li et al., 2022). Primary sources provide firsthand evidence directly from the supplier, such as demonstrations, technical specifications, and pilot testing results, allowing us to assess the technology’s direct impact and functionality. Secondary sources, such as independent reviews, industry reports, and academic studies, offer an analytical perspective by interpreting and synthesising primary data, giving us insights into broader industry acceptance and comparative effectiveness. By integrating both sources, we can form a well-rounded perspective that enhances our decision-making accuracy and confidence.
Can you spot bias or illogical, or unethical arguments in your peer’s initial post? Explain your response and give examples.
Peer Responses
Responding to peers is one of the vital parts of the BUS 225 2-2 Discussion: Making Decisions and Overcoming Bias Using Research posts. We need to provide at least two peer responses. I will provide one example post. You can write your peer responses by keeping the following points in mind.
- Recognition of Bias: Look for undue favour or scepticism towards the supplier or technology without sufficient evidence.
- Logical Fallacies: Identify if conclusions are drawn without a clear connection to the evidence presented.
- Ethical Considerations: Point out if any ethical issues are overlooked, such as the supplier’s exclusivity claim potentially limiting competition.
- Constructive Feedback: Offer feedback respectfully and constructively, focusing on the argument’s content rather than the individual’s character.
Response 01
Reviewing your post, I noticed a potential bias in the uncritical acceptance of the supplier’s claim that 90% of the industry would adopt this new technology without presenting any independent market analysis or evidence to support this statistic. This could lead to a skewed view that may not accurately reflect industry trends. Additionally, the supplier’s exclusivity claim might limit competition, raising ethical concerns about market fairness that weren’t addressed. It would be beneficial to incorporate more diverse sources and perhaps a more critical perspective on the supplier’s motives and claims to strengthen the analysis.
Closing
This How-To Guide allows you to understand the critical role of decision-making and overcoming bias using business
research. Following the guidelines, you can solve BUS 225 2-2 Discussion: Making Decisions and Overcoming Bias Using
Research like a pro. Good luck!
In the next module of BUS-225, we will explore the 3-1 Project One Submission.
References
Li, C., Chen, Y., & Shang, Y. (2022). A review of industrial big data for decision making in intelligent manufacturing. Engineering Science and Technology, an International Journal, p. 29, 101021
BUS 225 3-1 project one submission
Instructions for BUS 225 3-1 project one submission
Scenario
You are the sales department manager for a U.S.-based company that builds engines for the automotive manufacturing industry. Your company is considering diversifying into other business opportunities where your motors can be sold to bolster the company’s portfolio and increase revenue. Based on your knowledge of the national sales landscape, your manager would like you to conduct preliminary research and prepare a presentation with your recommendation for an opportunity in a new industry that will allow for this diversification through a new sales division and increased sales. You have been asked to make your presentation at the next stakeholder meeting, where you will address internal stakeholders from across the company as well as external stakeholders such as customers, investors, and suppliers.
As a preliminary step in developing this presentation, your manager would like to see an executive summary of your research findings and evaluate your decision modeling.
Directions
Complete the Project One Worksheet in your Soomo webtext and submit it for instructor feedback.
Part 1: Define
You will first research the U.S.-based automotive manufacturing industry using the Shapiro Library database links provided in the supporting materials section below. Then, prepare an analysis report that addresses the following:
- Define the problem.
- Explain the type of qualitative and quantitative data you will be targeting in your research.
- Provide a broad description of the U.S. automotive manufacturing industry and its value. Include:
- Total value of the industry
- Sales by region
- Sales by fuel type: electric, hybrid, and gas
- Describe the current trends in the automotive market.
- The trend toward different types of motors for the vehicles being made and sold, such as electric and hybrid
- Trends in customer demands, such as vehicle color, extra features, and styles
- Trends in the body types of vehicles sold (SUVs, trucks, sedans)
Part 2: Research
In Module One, you chose an industry that you think would provide an opportunity for your company. Now, using industry-specific and scholarly resources to inform your decision, prepare an industry analysis report that includes the following:
- Provide a broad description of the new industry.
- Describe the overall attractiveness of the industry.
- Is this a growing industry?
- Is this an industry that has a lot of growth potential?
- What outside factors are affecting its growth?
- Identify the factors that have allowed competitors to be successful in this industry thus far.
- Summarize the overall value of the industry.
- Describe the overall attractiveness of the industry.
- How is the industry currently trending?
- Summarize the sales. Speculate if sales vary based on the region of the country. (For example, there would be very few snow plow sales in the southern United States, if any at all.)
- Define expected growth areas.
- Describe the current market trends for the new industry.
- What products or services are trending?
- What are some current customer demands?
- Perform a Porter’s Five Forces analysis to determine the potential success of moving into this new industry.
- Explain your rationale.
Part 3: Compare
Compare the two industries and summarize your findings.
- Perform a Porter’s Five Forces analysis to compare the two industries.
- Summarize how your findings address the problem.
What to Submit
To complete this project, submit an executive summary report of 3 to 4 pages using the provided templates, or the document you downloaded from Soomo. Sources should be cited according to APA style.
Supporting Materials
The following resources support your work on the project:
- Project One Template Word Document
- Porter’s Five Forces Analysis Template (PPT)
- Shapiro Library Database: IBISWorld
- Shapiro Library Database: MarketLine
Introduction to BUS 225 3-1 Project One
This Owlisdom How-To Guide, tailored specifically for your role as a Manager of the sales department for a US-based engine manufacturer, is crucial in preparing a comprehensive presentation. BUS 225 3-1 project one submission is a strategic exploration of diversification opportunities in the automotive industry, focusing on identifying potential new markets. Your role in this project is pivotal as it aims to enhance the company’s portfolio and increase revenue through strategic expansion.
As part of BUS 225 3-1 project one submission, you will learn how to navigate and complete a research assignment on identifying potential business diversification opportunities. This involves a detailed analysis of the automotive manufacturing industry, an exploration of a new sector of your choice, and a comparison between the two using strategic frameworks like Porter’s Five Forces.
Note that you will receive a template to solve BUS 225 3-1 project one submission. This template, which I am using by SNHU as an example to provide a dummy solution, is designed to guide you through the various sections of the project, ensuring a structured and comprehensive approach to your analysis.
- Define the problem.
- Explain the qualitative and quantitative data you will target in your research.
- Provide a broad description of the U.S. automotive manufacturing industry and its value. Include:
- The total value of the industry
- Sales by region
- Sales by fuel type: electric, hybrid, and gas
- Describe the current trends in the automotive market.
- The trend toward different types of motors for the vehicles being made and sold, such as electric and hybrid
- Trends in customer demands, such as vehicle color, extra features, and styles
- Trends in the body types of vehicles sold (SUVs, trucks, sedans)
Part 1: Define the Problem and Describe the U.S. Automotive Industry
Research and Data Collection
- Objective: Understand the scope of your company’s current industry.
- Guidelines: Utilize the Shapiro Library database to gather qualitative and quantitative data about the U.S. automotive manufacturing industry. Focus on sales data, market trends, and industry value.
Analysis of the Current Automotive Industry
- Define the Problem: Articulate why diversification is necessary; consider factors like market saturation or limited growth potential in current segments.
Industry Value and Sales Analysis
- Total Industry Value: Research the overall financial valuation of the U.S. automotive industry.
- Sales by Region and Fuel Type: Gather data on how sales differ across regions and between fuel types (electric, hybrid, gas).
Current Market Trends
- Motors: Analyze trends in motor types, focusing on shifts towards electric and hybrid technologies.
- Customer Demands: Look at changing preferences in colors, features, and styles.
- Body Types: Examine sales trends among vehicles like SUVs, trucks, and sedans.
Provide a broad description of the new industry.
- Describe the overall attractiveness of the industry.
- Is this a growing industry?
- Is this an industry that has a lot of growth potential?
- What outside factors are affecting its growth?
- Identify the factors that have allowed competitors to be successful in this industry thus far.
- Summarize the overall value of the industry.
- How is the industry currently trending?
- Summarize the sales. Speculate if sales vary based on the region of the country. (For example, there would be very few snowplow sales in the southern United States, if any.)
- Define expected growth areas.
2. Describe the current market trends for the new industry.
- What products or services are trending?
- What are some current customer demands?
3. Perform a Porter’s Five Forces analysis to determine the potential success of moving into this new industry.
- Explain your rationale.
Part 2: Research the New Industry
Industry Analysis
Describing a New Industry
- Choose a new industry and describe its overall attractiveness:
- Growth potential and external factors impacting it.
- Success factors of current competitors.
Overall Attractiveness
- Assess external factors influencing growth.
- Success Factors: Identify critical elements that have allowed existing competitors to succeed.
- Industry Value and Sales Trends: Estimate the overall market size and speculate on regional sales variations.
Market Trends and Potential Success Analysis
- Current Trends: Determine which products or services are gaining popularity.
- Porter’s Five Forces Analysis: Evaluate the competitiveness of the industry and the potential profitability of entering this market. Discuss the findings and their implications for your decision.
- Perform a Porter’s Five Forces analysis to compare the two industries.
- Summarize how your findings address the problem.
Part 3: Compare the Two Industries
Comparative Analysis Using Porter’s Five Forces
- Compare the automotive industry with the new industry to identify which is more favorable for diversification.
- Conduct a detailed Porter’s Five Forces analysis for both industries. Summarize the key differences and how they relate to your company’s strategy and capabilities.
Closing
This How-To guide of SNHU Bus 225 project 1 will enhance your strategic insights and be crucial in guiding the company’s decision-making process. By following these guidelines, you can ensure the stakeholders are well-informed of the potential benefits and challenges of entering a new market. The BUS 225 3-1 project one submission enhances your understanding of strategic business expansion and equips you with the skills to make data-driven decisions in complex business environments.
In the next module of BUS-225, we will explore the 3-2 Discussion: The Importance of Data Visualizations
BUS 225 3-2 discussion: the importance of data visualizations
Instructions for BUS 225 3-2 discussion
Discussion
Data visualization methods offer a different landscape for explaining situations using data. Graphical representations of information, if created properly, can make vital information more intuitive, contextualized, and accessible. Visualization plays an essential part in analyzing big data and simplifying complex data-intensive scenarios.
In this discussion, using the Viz of the Day webpage, select a business-focused visualization to debate in your post (you may have to toggle to more than one page to see business-specific visualizations). Consider the audience and purpose of the visualization you selected, and think about the strategy used to present the information and analysis visually. In your initial post, make sure to include the link to the visualization you selected, and address the following:
- Why have you selected this one?
- How does the author of the visualization address the audience?
- How is the purpose of the visualization conveyed?
- How does the visualization use color, ordering, layout, and hierarchy to prioritize information?
In response to at least two of your peers, address the following:
- Can you describe ways in which data visualizations make information more accessible to their audience? What would you recommend to make key insights in visualizations more digestible to your audience? What would you avoid?
To complete this assignment, review the Discussion Rubric.
Introduction to BUS 225 3-2 Discussion
This discussion post revolves around your understanding of the importance of data visualizations. I will provide brief and descriptive guidelines to solve the BUS 225 3-2 discussion: the importance of data visualizations post, and a dummy solution for each section. This Owlisdom How-To Guide will equip you with guidelines to tackle all the queries related to the 3-2 Discussion post. Let us begin with the guide.
Introduction to Data Visualization
To start the BUS 225 3-2 discussion: the importance of data visualizations, we need to understand the role and importance of data visualization in making complex data more accessible and actionable.
- Familiarize yourself with the basic principles of data visualization, recognizing that compelling visualizations can transform raw data into easily understandable formats, thus aiding quicker decision-making and deeper analytical insights.
Selecting a Business-Focused Visualization
For this section of the BUS 225 3-2 discussion: the importance of data visualizations, we will choose a visualization that effectively represents a business scenario.
- Visit the Viz of the Day webpage to explore various visualizations.
- Navigate through the site to locate visualizations tailored explicitly to business contexts. You might need to view multiple pages.
- Select a visualization that catches your eye and seems to encapsulate complex business data intuitively.
Analysis of the Selected Visualization
Next, in BUS 225 3-2 discussion: the importance of data visualizations. We will critically evaluate the visualization to understand how it presents complex data.
- Purpose: Determine why this visualization is effective for its intended business context.
- Audience: Consider who the visualization is designed for—executives, analysts, the general public, etc., and how it meets the needs of this audience.
- Design Elements: Analyze how color, layout, ordering, and hierarchy enhance comprehension and highlight key data points.
How does the visualization use color, ordering, layout, and hierarchy to prioritize information?
Crafting Your Initial Discussion Post
The main objective of BUS 225 3-2 discussion: the importance of data visualizations is to write a well-structured and insightful discussion post that addresses specific aspects of the visualization.
- Introduction: Start by introducing the visualization and including a direct link.
- Justification for Selection: Explain why you chose this particular visualization.
- Audience Address: Describe how the visualization is tailored to its intended audience.
- Purpose Conveyance: Discuss how the purpose of the visualization is effectively communicated through its design.
- Design Analysis: Evaluate visual design elements and how they prioritize and organize information.
Example
I selected an engaging business-related visualization from the Viz of the Day on Tableau Public, which can be viewed here. This particular visualization captures my attention due to its dynamic representation of evolving market trends within the tech industry. It effectively encapsulates a broad range of data in a digestible format that can benefit a variety of audiences, particularly those interested in technological market dynamics.
The visualization is tailored for business professionals, utilizing appropriate business jargon and presenting data through a lens that emphasizes critical decision-making factors such as growth trends and competitive positioning. The clarity and depth of the data cater specifically to those familiar with market analysis, making it an invaluable tool for strategists and executives.
The purpose of the visualization—to convey critical insights into tech market dynamics—is effectively communicated through its structured layout. It guides viewers through a logical progression from general market conditions to specific insights about consumer preferences, highlighting the narrative of market evolution and competitive strategy. This structured approach helps us effortlessly understand complex data.
The design employs strategic use of color, ordering, layout, and hierarchy to enhance readability and help prioritize information. Bold colors draw attention to critical data trends and variances, while the hierarchical layout helps distinguish primary data points from secondary ones. The thoughtful ordering of data from left to right and top to bottom aids natural eye movement across the visualization, ensuring viewers can easily follow the story the data tells.
This visualization is an excellent example of how complex data can be transformed into an intuitive, strategic, and visually appealing format, proving a potent tool for informed business decision-making.
Can you describe how data visualizations make information more accessible to their audience? What would you recommend to make critical insights in visualizations more digestible to your audience? What would you avoid?
Peer Responses
Responding to peers is one of the vital parts of the BUS 225 3-2 discussion: the importance of data visualization posts. We need to provide at least two peer responses. I will provide one example post. You can write your peer responses by keeping the following points in mind.
- Content Analysis: Assess how effectively your peers have understood and articulated the role of data visualization in enhancing information accessibility.
- Recommendations: Provide concrete suggestions on how to make visualizations more digestible, such as simplifying complex visuals, using consistent and clear color schemes, or avoiding information overload.
- Constructive Critique: Keep your feedback positive and constructive, focusing on improving the visualization rather than merely criticizing.
Response 01
Data visualizations simplify complex information, making it more intuitive for the audience by visually organizing data. To enhance digestibility, I recommend using explicit color schemes and avoiding clutter. It’s crucial to focus on essential data points to prevent overwhelming the viewer with too much information at once.
Closing
By following these guidelines of BUS 225 3-2 discussion: the importance of data visualizations, you can engage deeply
with data visualizations, offering and receiving insightful critiques that enhance your and your peers’
understanding of effective data presentation in business contexts.
In the next module of BUS-225, we will
explore the 4-1 Assignment: Making Data-Driven Decisions.
BUS 225 4-1 assignment: making data-driven decisions
Instructions for BUS 225 4-1 Assignment
Overview
To make sense of all the data available to them, business leaders work alongside data scientists who generate data visualizations to understand business questions via analytics. This process gives companies insight on what is working and what is not: for example, whether the products or services offered are meeting expectations, or if a shift in strategy is necessary.
Prompt
For this assignment, you will take on the role of a business leader who wishes to analyze if a new product their company has introduced is meeting the expectations. Imagine that you would like to create a post in the company intranet that summarizes your findings in an easy-to-read format for your team. Pay special attention to creating meaningful data visualizations. You should use techniques that make content easy to follow but that also display charts accurately without distorting or skewing data. Your company’s profit goal is 25% of the cost of goods sold (COGS). Remember, COGS is the cost of manufacturing the product, including labor, materials, and overhead. You will need to build trust and an open channel of communication with other leaders on your team. Pay close attention to the story that data visualizations tell you and others reviewing your post.
The purpose of this analysis is to better understand the cost, revenue, and profit associated with the new product launch. Review the cost, revenue, and profit spreadsheet retrieved from the company’s data center and consider the following while developing your ideas in this assignment.
- What is the importance of data analysis?
- What are the results of your analysis?
- Think about your analysis and its findings, including visuals. Use visuals and text to re-state the purpose of
your analysis and summarize your most important findings.
- What are you trying to represent with this data?
- What kind of graphic have you selected and why?
- How did adding visual representations of the data change your analysis?
- Does the target audience influence the way you display information?
Guidelines for Submission
Complete the Making Data-Driven Decisions worksheet in your Soomo webtext, download your completed work, and submit it in Brightspace for instructor feedback. You should write using a professional voice, and any sources should be cited according to APA style. Your assignment must be between 400 and 800 words in length.
Introduction to BUS 224 4-1 Assignment
This Owlisdom How-To Guide aims to assist you in solving the BUS 225 4-1 assignment: making data-driven decisions by helping you analyse and understand the financial metrics associated with a new product launch. Through careful examination and visualisation of data, you will determine if the product aligns with the company’s profit goals and make informed decisions.
What is the importance of data analysis?
Understanding the Importance of Data Analysis
To start the BUS 225 4-1 assignment: making data-driven decisions, we will first discuss the importance of data analysis using the data spreadsheet provided along with the assignment instructions.
- Data Analysis Significance: Acknowledge how data analysis aids in assessing product performance and guiding strategic decisions.
Example
Data analysis is pivotal in the contemporary business landscape, providing empirical evidence to support decision-making. By examining data from the provided spreadsheet, leaders can measure the new product’s performance against established financial targets like the profit goal related to COGS. This practice enables the detection of trends, inefficiencies, and opportunities, guiding strategic decisions toward optimisation. Moreover, data analysis informs resource allocation and can signal the need for potential strategy pivots, ensuring the company remains agile and competitive. It transforms raw numbers into actionable insights, encapsulating the modern liberal arts ethos of applying diverse analytical skills to solve practical challenges.
What are the results of your analysis?
Conducting the Analysis
Next, in this section of BUS 225 4-1 assignment: making data-driven decisions, we will analyse the data.
- Reviewing Spreadsheet Data: Familiarize yourself with the company’s spreadsheet, focusing on COGS, revenue, and profit figures.
- Identifying Key Metrics: Pinpoint essential metrics reflecting the company’s profit goal of 25% of COGS.
Example
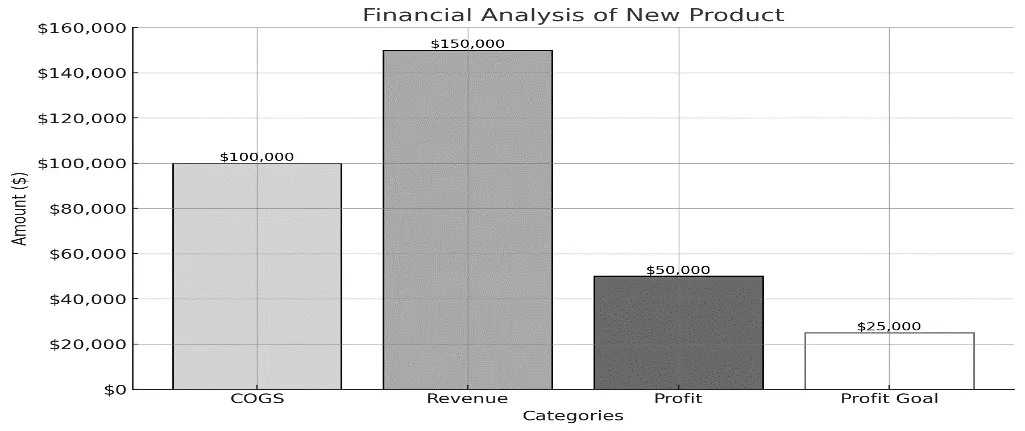
Upon reviewing the data, we observe that the COGS for our new product is $100,000. Revenue stands at $150,000, indicating a gross profit of $50,000. To achieve our company’s profit goal, the profit should be 25% of the COGS, which would be $25,000. Our profit surpasses this goal by 100%, showcasing a successful product launch.
However, it’s crucial to consider whether this level of profit is sustainable and if it can be replicated across other products or markets. The analysis should continue to ensure that the profit margin reflects a genuine market demand and not a one-time surge or a pricing strategy that may not be viable long-term. Such scrutiny aligns with the liberal arts tradition of critical thinking and analytical scrutiny, allowing for a multifaceted examination of business performance.
Think about your analysis and its findings, including visuals. Use visuals and text to restate the purpose of your study and summarise your most important findings.
What kind of graphic have you selected and why?
Visualising the Data
For this section of the BUS 225 4-1 assignment, making data-driven decisions, we will explain our findings of the analysis using visuals as graphs.
- Choosing Visuals: Decide on visuals like bar charts or line graphs that represent cost, revenue, and profit data without distortion.
- Data Representation: Ensure the selected visuals effectively communicate the data’s story and support your textual analysis.
Example
X-axis: Label the x-axis with the categories “COGS,” “Revenue,” “Profit,” and “Profit Goal.”
Y-axis: Label the y-axis as “Amount ($)” with suitable increments representing values from $0 to $150,000.
COGS Bar: representing $100,000.
Revenue Bar: representing $150,000.
Profit Bar: representing $50,000.
Profit Goal Bar: $25,000 to indicate the target.
How did adding visual representations of the data change your analysis?
Does the target audience influence the way you display information?
Interpreting the Impact of Visual Data
For the last section of the BUS 225 4-1 assignment: making data-driven decisions, we will interpret the impact of using visuals for our data.
- Visual Influence on Analysis: Reflect on how visuals aid in understanding the analysis better and if they reveal any new insights.
- Audience Consideration: Adapt the display of information to the target audience within the company for clarity and impact.
Example
Adding visual representations of data enhanced our analysis by providing a more precise understanding and revealing new insights. Visuals, such as graphs or charts, allow for easier comparison and identification of patterns, facilitating interpretation. Moreover, considering the target audience is crucial as it influences how information is displayed. Tailoring visuals to suit the audience’s preferences and level of expertise ensures clarity and impact. For instance, presenting complex data with simplified visuals for non-technical stakeholders enhances comprehension. Thus, incorporating visuals not only aids analysis but also optimises communication within the company.
Closing
This How-To guide of BUS 225 4-1 assignment: making data-driven decisions helps you understand that data
visualisations are a powerful tool for communicating complex information. Your findings will inform the team about
the new product’s performance and foster an environment of transparency and data-driven decision-making. Your
ability to translate data into meaningful visuals is integral to this process and to building trust with your
colleagues.
In the next module of BUS-225, we will explore the 4-2 Discussion: Developing Visualizations for
Your Story.
BUS 225 4-2 discussion: developing visualizations for your story
Instructions for BUS 225 4-2 discussion
Discussion
Key building blocks of good decision-making include the ability to visualize, analyze, and verbally communicate ideas effectively. Large volumes of data can be particularly complex to understand and present. However, if data is visually presented through a combination of meaningful charts, text, and a verbal narrative, the intended audience can better engage in the discussion of the facts, patterns, and findings that must be acknowledged before moving to the decision-making stage.
In this discussion, you will take on the role of a new restaurant owner who is checking on sales since the opening of your establishment in January. You have just downloaded the following sales data from your financial software: Module Four Discussion Sales Data Spreadsheet. It includes sales by food item for each month you have been in business. You would like to create visualizations that illustrate which items are selling well and how the business is doing month by month.
In your initial post, make sure to include the visualizations you created and address the following:
- What have you been able to identify through the visual representation of the data?
- What kind of graphic have you selected and why?
- How would this visualization need to be changed based on your audience?
In response to at least two of your peers, address the following:
- Do you think your peer’s data visualization clarifies the data or makes it more confusing? Why and how so?
To complete this assignment, review the Discussion Rubric.
Introduction to BUS 225 4-2 Discussion
This Owlisdom How-To Guide aims to assist you in effectively completing the task of analyzing sales data for a new restaurant and creating visualizations to aid decision-making. Following these guidelines, you can learn how to interpret data, choose appropriate visualizations, consider audience preferences, and quickly solve BUS 225 4-2 discussion: developing visualizations for your story.
What have you been able to identify through the visual representation of the data?
Understanding Data Visualization
We will first understand the data visualization to start the BUS 225 4-2 discussion: developing visualizations for your story.
- Analyze the provided sales data to identify trends and patterns.
- Select critical insights to be visualized.
- Choose appropriate visualization types (e.g., bar charts, line graphs) based on the nature of the data and the insights you want to convey.
Example
I have identified several key trends and patterns through the sales data analysis. Pizza and burgers consistently increase monthly sales, indicating strong and growing demand. Conversely, the pasta, salad, and soup sales demonstrate more modest growth, suggesting a stable but less dynamic market presence.
For visualization, I would choose a line graph to depict the sales trends for pizza and burgers due to their dynamic growth, highlighting their success and popularity. A bar chart might be more suitable for pasta, salad, and soup, illustrating their steady sales over the months.
This approach allows for a clear and compelling presentation of data, adhering to the principles of modern liberal arts by combining analytical rigor with strategic communication. This ensures that the data is understood in a business context and appreciated for its broader implications on strategic decision-making.
What kind of graphic have you selected and why?
Creating Effective Visualizations:
Next, in BUS 225 4-2 discussion: developing visualizations for your story. We will create compelling visuals based on the data.
- Utilize software tools such as Excel or Google Sheets to create visual representations of the data.
- Ensure clarity and accuracy in labeling axes, titles, and data points.
- Select colors and formatting that enhance readability and visual appeal.
Example
I created a stacked bar chart using Google Sheets for the sales data visualization. This format allows for a clear month-by-month comparison of all food items, showcasing how each contributes to the total sales over time. The stacked layout helps understand the proportionate contribution of each item, like pizza, burgers, pasta, salad, and soup, to the overall revenue.
Each bar will be distinctly colored to differentiate between food items, ensuring that the chart is visually appealing and easy to read. Axes will be clearly labeled with months on the x-axis and sales figures on the y-axis, and each segment will be annotated to show exact sales numbers. This simple yet effective graphical representation adheres to the liberal arts approach of synthesizing information in a manner accessible to diverse audiences, facilitating informed decision-making.
How would this visualization need to be changed based on your audience?
Considering Audience Preferences
The next section of BUS 225 4-2 discussion: developing visualizations for your story revolves around considering audience preferences while creating visuals.
- Understand the demographics and knowledge level of your audience.
- Adapt the complexity of visualizations; accordingly, simplify for non-technical audiences and provide detailed insights for experts.
- Consider the context in which the data will be presented and adjust visualizations to suit the audience’s needs and expectations.
Example
Adapting visualizations to the audience is essential for clarity and engagement. Simple bar or pie charts with clear labels and minimal jargon are best for non-technical viewers. These focus on broad trends and are easy to understand. For experts, more complex visuals like stacked bars or line graphs with detailed data allow for deeper analysis. Both approaches should leverage the liberal arts' focus on clarity and critical thinking, ensuring the visuals are informative and accessible, supporting informed decision-making.
Do you think your peer’s data visualization clarifies the data or makes it more confusing? Why and how so?
Peer Response
Responding to peers is one of the vital parts of the BUS 225 4-2 discussion: developing visualizations for your story posts. We need to provide at least two peer responses. I will provide one example post. You can write your peer responses by keeping the following points in mind.
- Evaluate your peers’ visualizations based on clarity, accuracy, and relevance.
- Provide constructive feedback on whether the visualization enhances understanding or adds confusion.
- Support your evaluation with specific examples and suggestions for improvement.
Response 01
Your visualization presents the data clearly, enhancing understanding significantly. The choice of a stacked bar chart effectively delineates the monthly sales of different food items, making it easy to observe trends at a glance. However, to reduce potential confusion, consider using a more distinct color palette to differentiate between items further. This would help viewers quickly identify each category without mixing them up, especially in months when sales volumes are close. In the context of the BUS 225 Module 4 Discussion, refining the visual clarity with a better color distinction would contribute to a more effective and accessible data presentation.
Closing
BUS 225 4-2 Discussion enhances your mastery of data visualization and analysis skills, which are crucial for
effective decision-making in business settings. By following the BUS 225 4-2 discussion: developing visualizations
for your story guide, you can learn to interpret data, create meaningful visualizations, and cater to the
preferences of your target audience.
In the next module of BUS-225, we will explore the 5-1 Project Two on Data
Analysis and Decision-Making.
BUS 225 5-1 Project Two: Data Analysis and Decision Making
Instructions for BUS 225 5-1 project two
Scenario
You have been asked to present your data findings and decision-making modeling to the leadership panel for feedback before the stakeholder meeting presentation. The panel wants to preview the charts and graphs that will be included in your presentation based on the research you have conducted. They would like to see how you will use the data to inform your recommendation, and how you will tell the story of that data.
Directions
Part 1: Using the research gathered in Project One, provide a visualization for each of the following, then summarize what the data is showing:
- The current state of the U.S. automotive manufacturing industry
- Sales by fuel type (electric, hybrid, gas)
- Current automotive industry trends
- The trend toward different types of motors for the vehicles being made and sold, such as electric and hybrid
- Trends in customer demands, such as vehicle color, extra features, and styles
- Trends in the body types of vehicles sold (SUVs, trucks, sedans)
- Trends in the new industry
- Expected growth areas
- Sales by type of products or services offered
- Trends in customer demands
Then, provide a summary of all of the data visualized.
- Summarize the collective data about both industries as a whole.
- Determine what the data is not telling you about the new industry.
Part 2: Analyze three decision-making models and select the one model that is best suited for making your decision.
- Analyze and provide an overview of the following three models and select one for use. Resources are listed in
the Supporting Materials section.
- The Rational Model
- The Intuitive Model
- The Recognition-Primed Model
- Explain your choice of decision-making model.
- Why does your selection make the most sense for this project?
What to Submit
To complete this project, you must submit a PowerPoint presentation of 12 to 15 slides with speaker notes. Sources should be cited according to APA style.
Supporting Materials
The following resources support your work on the project:
- Reading: Rational Decision Making: The 7-Step Process for Making Logical Decisions
- Reading: Intuitive Decision Making
- Reading: The Recognition-Primed Decision Model
Introduction to BUS 225 5-1 Project
For BUS 225 5-1 project two, we need to closely read and understand the given instructions and provide a solution of 12-15 slides of a PPT presentation. Here, I will give brief, clear guidelines to understand the BUS 225 5-1 project two. You can make easy and professional PPT slides for BUS 225 5-1 project two using these guidelines.
For each of the following, create a visualization based on the research collected in Project One, and then provide a summary.
Visualizing Data
A. The current state of the U.S. automotive manufacturing industry
- Sales by fuel type (electric, hybrid, gas)
The U.S. Car Industry
- Display sales by fuel type (electric, hybrid, gas).
- Use bar graphs or pie charts to represent sales data. Ensure each segment is clearly labeled and color-coded.
- Briefly describe trends, such as the rising popularity of electric vehicles.
B. Current automotive industry trends
- The trend toward different types of motors for the vehicles being made and sold, such as electric and hybrid
- Trends in customer demands, such as vehicle color, extra features, and styles
- Trends in the body types of vehicles sold (SUVs, trucks, sedans)
Recent Trends in the Automotive Industry
- Illustrate patterns in motor types, customer demands, and body types.
- Motor Types: Create line graphs to show the evolution in adopting electric and hybrid motors over time.
- Use stacked bar charts to depict variations in vehicle colors, features, and styles.
- A pie chart shows the market share of SUVs, trucks, and sedans.
C. Trends in the new industry
- Expected growth areas
- Sales by type of products or services offered
- Trends in customer demands
Trends in the New Industry
- Explore anticipated areas of growth, sales by product type, and customer demands.
- Utilize heat maps to highlight regions or segments with high growth potential.
- Bar charts show sales distribution across products or services.
- Radar charts to compare various demand factors in a visually engaging way.
Then, provide a summary of all of the data visualized.
- Summarize the collective data about both industries as a whole.
- Determine what the data is not telling you about the new industry.
Summary of Data Visualizations
- Consolidate and summarize the visualized data from both industries.
- Create a comprehensive summary using bullet points highlighting key findings from each dataset.
- Discuss what the data reveals about market trends and potential shifts. Identify gaps where data might be insufficient, particularly concerning new industry insights.
Analyze three decision-making models and select the one best suited for making your decision.
Decision-Making Models Analysis
A. Analyze and provide an overview of the following three models and select one for use. Resources are listed in the Supporting Materials section.
- The Rational Model
- The Intuitive Model
- The Recognition-Primed Model
Summary of Models
Describe the Rational Model, the Intuitive Model, and the Recognition-Primed Model. Focus on how each model processes information and makes decisions.
- Provide an overview and analyze three decision-making models: Rational, Intuitive, and Recognition-Primed.
- In BUS 225 Module 5 Project Two, you will need to briefly describe each model using clear, concise language. It’s essential to break down the concepts in a way that is easy to understand. To further enhance comprehension, use diagrams or flowcharts to visually represent each model’s process.
B. Explain your choice of decision-making model.
- Why does your selection make the most sense for this project?
Selection and Rationale
Choose the model that best fits the needs of this project. Justify your choice based on the specifics of the industry data and the types of decisions that need to be made.
- Justify the selection of one model over the others.
- Discuss the strengths and weaknesses of each model in the context of your project.
- Conclude with a persuasive paragraph on why the selected model (e.g., The Rational Model for its structured approach to decision-making) is best suited for analyzing the automotive industry data.
Closing
This Owlisdom How-To Guide allows you to understand the BUS 225 5-1 project two.
Following the guidelines, you can solve the BUS 225 5-1 project two like a pro. Good luck!
In the next module
of BUS-225, we will explore the 5-2 Discussion on Reflecting on Your Decision-Making Style.
Speaker’s Notes
Slide 2: The graph shows which fuel is chosen and why.

Slide 3: Trends in motor varieties, emphasizing the most popular.
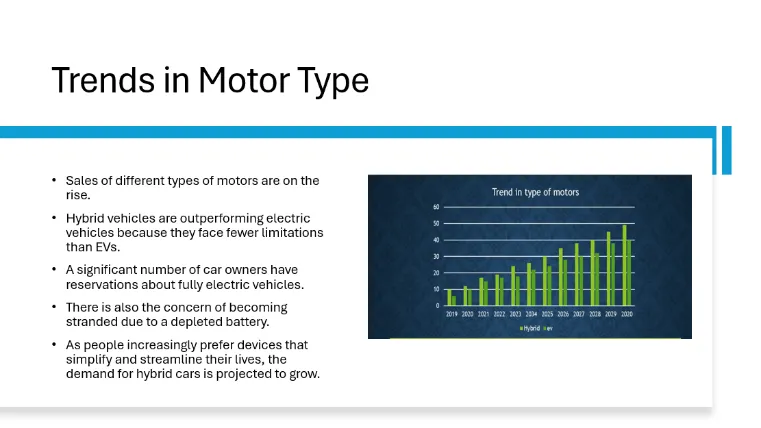
Slide 4: The illustration will explain why most people like white cars over those in other colors.
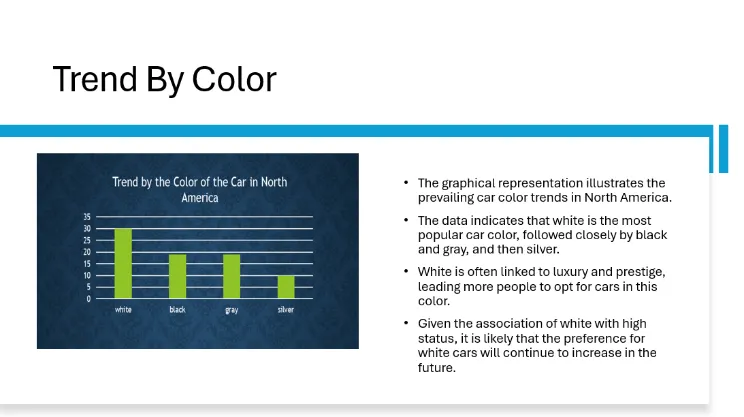
Slide 5: The graph will demonstrate why consumers favor one automobile over another. SUVs, sedans, trucks, and vans are among the vehicles under consideration.
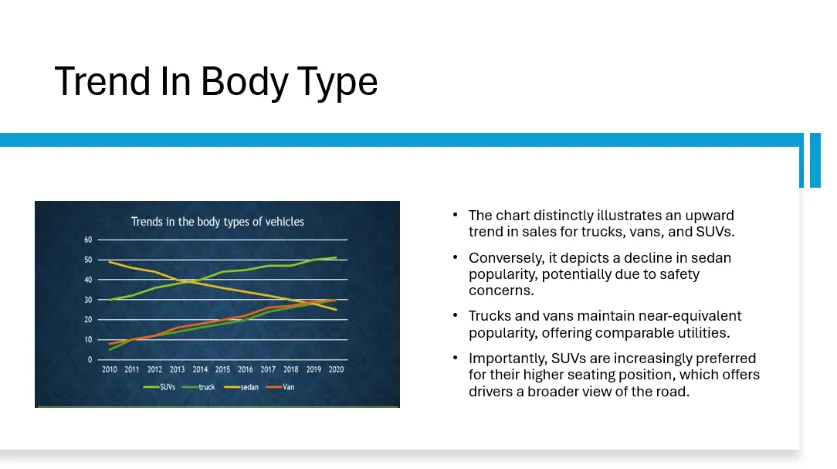
Slide 6: The graphs will depict the regions expected to develop due to power generator consumption.
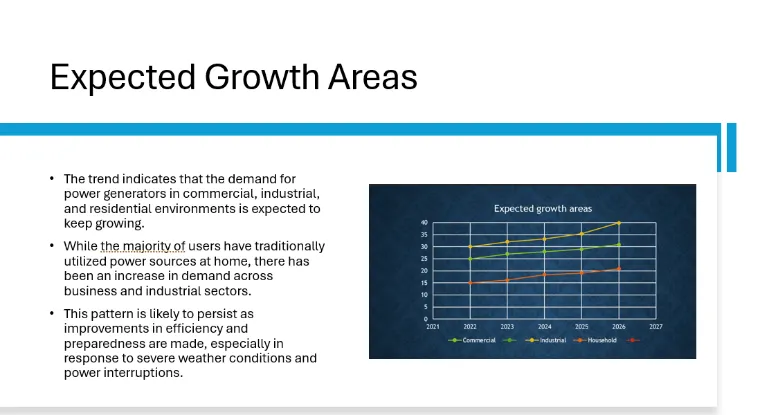
Slide 7: The graph will demonstrate why people favor hybrid generators over single-source generators.
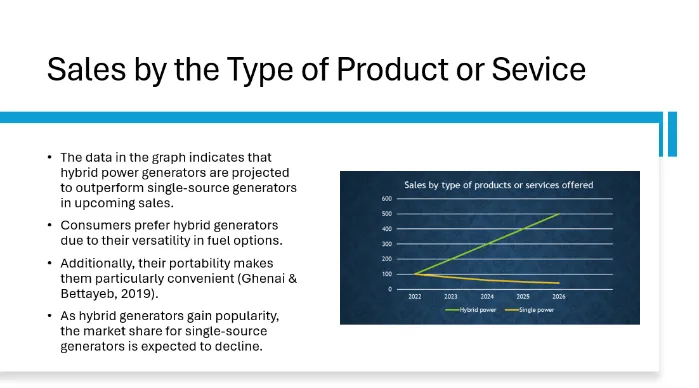
Slide 8: The graph depicts the expected demand for hybrid and single-source power generators.
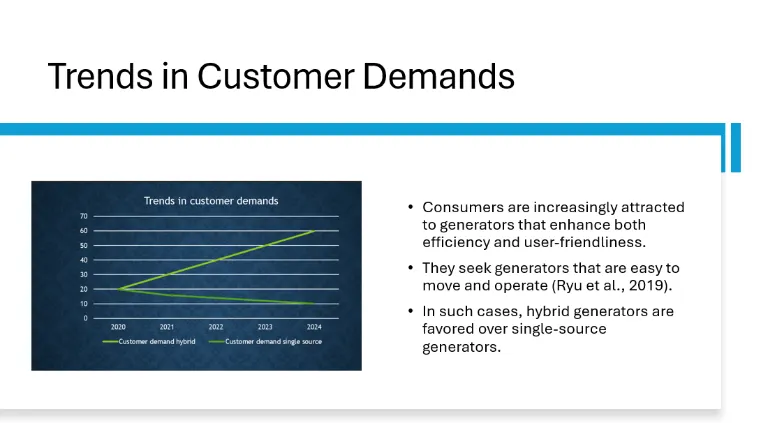
Slide 9: A brief overview of the various sectors and what the statistics do not reveal about each business.
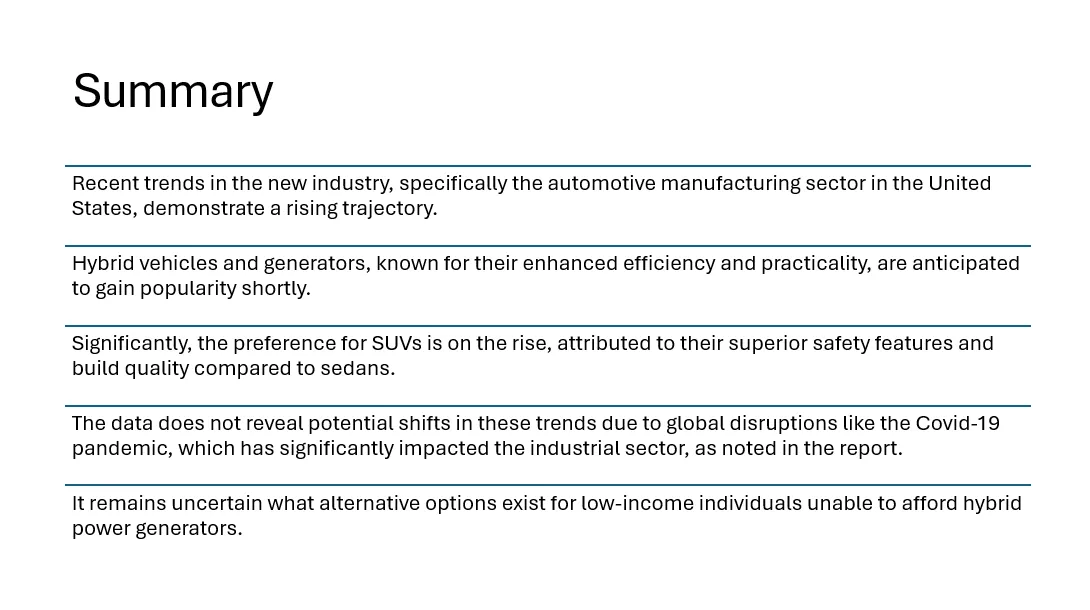
Slide 10: Comparing models and selecting the best one to employ in decision-making.
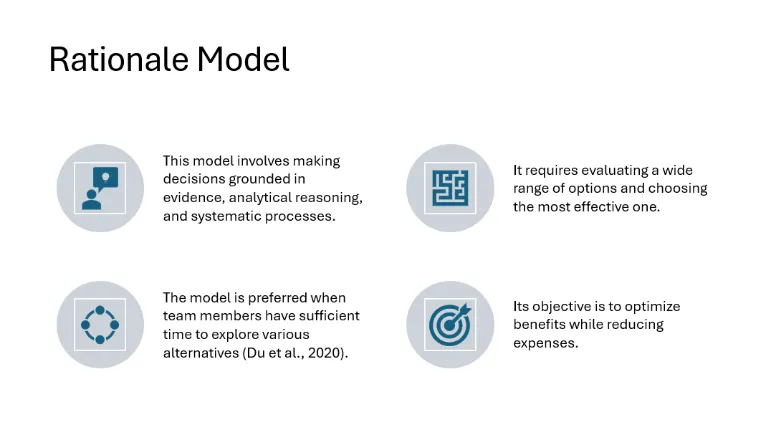
Slide 11: The Intuitive Model: An Overview of Its Value.
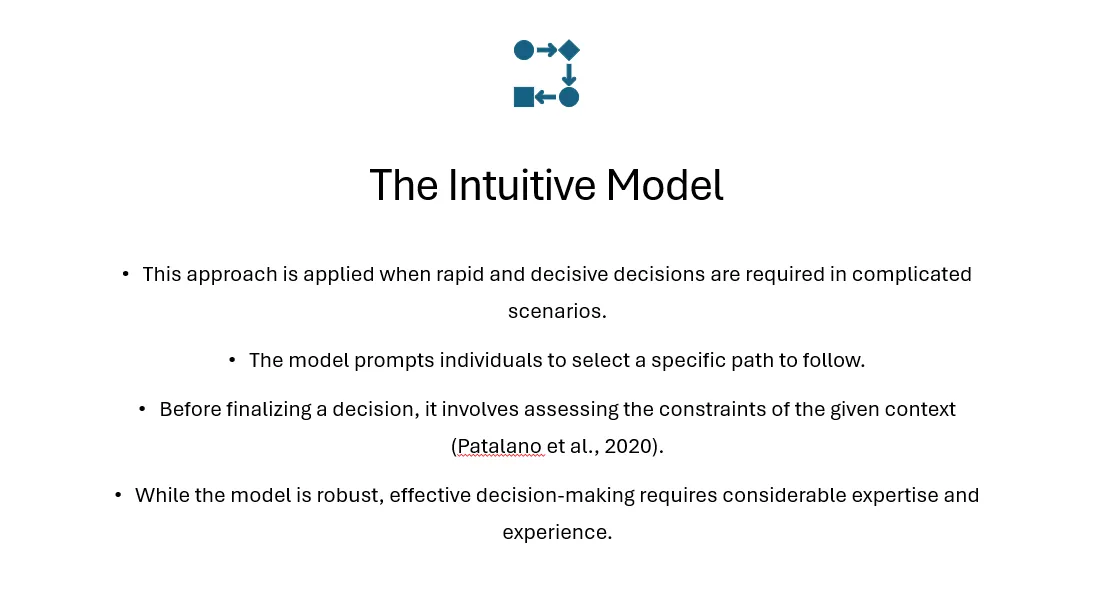
Slide 12: The recognition-primed model in brief.
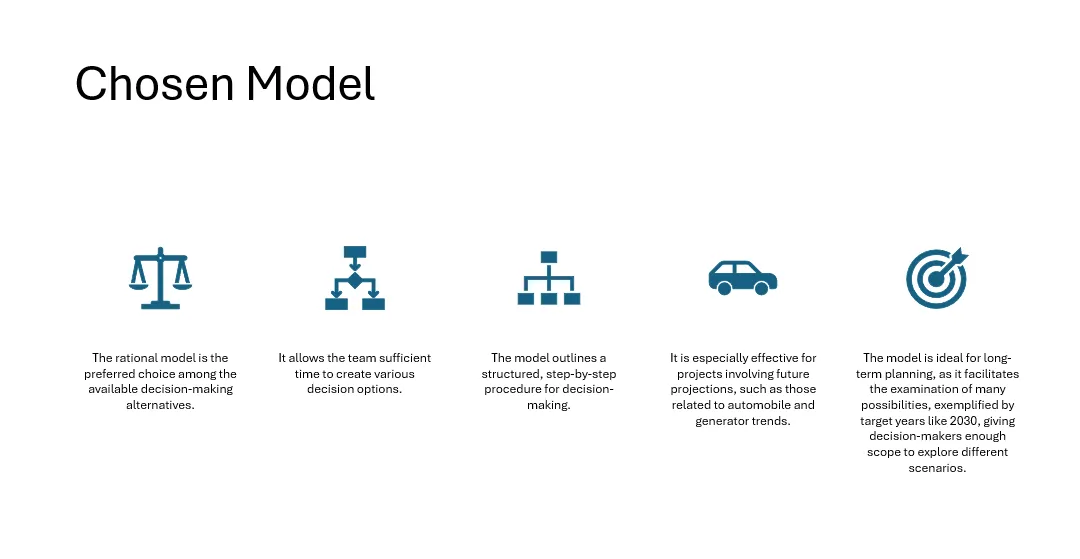
Slide 13: Model selection and why it is beneficial.
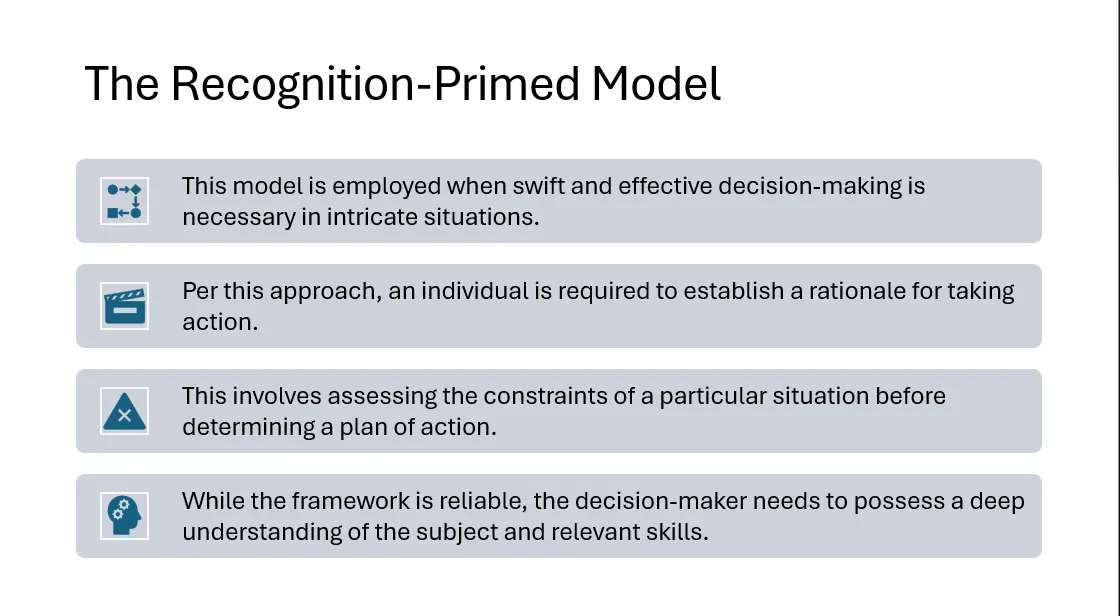
BUS 225 5-2 Discussion: Reflecting on Your Decision-Making Style
Instructions for BUS 225 5-2 Discussion
Discussion
An important step in making better decisions is learning about yourself and acknowledging the bad decisions you have made. While you shouldn’t dwell on past mistakes, you can learn significant lessons from unsuccessful experiences. Effective leaders are not afraid to take responsibility for plans that didn’t work out and take steps to make things better.
In this discussion, think about a time you have made a poor decision for a group. Think about a decision you have made that impacted your family, colleagues, friends, or community. In your initial post, address the following:
- What was the context and decision you made?
- What was your decision-making style?
- What went wrong?
In response to at least two of your peers, address the following:
- What kind of plan would you suggest your peer put in place to prevent bad decisions in the future? Share the reasons for your suggestions.
To complete this assignment, review the Discussion Rubric.
Introduction to BUS 225 5-2 Discussion
The BUS 225 5-2 Discussion: Reflecting on Your Decision-Making Style post revolves around your understanding of Reflecting on Your Decision-Making Style. I will provide brief and descriptive guidelines to solve the 5-2 Discussion posts and a dummy solution for each section. This Owlisdom How-To Guide will equip you with guidelines to tackle all the queries related to the BUS 225 5-2 Discussion post. Let us begin with the guide.
Self-Reflection
To start BUS 225 5-2 Discussion: Reflecting on Your Decision-Making Style, we will reflect on the decision-making mistakes we made in the past.
- Reflect on past decisions and acknowledge any mistakes made.
- Avoid dwelling on the past, but focus on learning lessons from unsuccessful experiences.
Example
Reflecting on past decisions is crucial for personal growth. It’s essential to acknowledge mistakes without dwelling on them. Instead, focus on extracting valuable lessons from those experiences. By understanding what went wrong, we can develop better decision-making skills and make more informed choices in the future.
What was the context and decision you made?
Identify Context and Decision
Now, in BUS 225 5-2 Discussion: Reflecting on Your Decision-Making Style. We will discuss the context of the decisions.
- Recall a specific decision that significantly impacted a group, whether it’s your family, colleagues, friends, or community.
- Clearly outline the context and details of the decision.
Example
One particular decision that significantly impacted my community was organizing a charity fundraiser event. The context involved raising funds for a local homeless shelter. As part of the organizing committee, we had to decide on event logistics, marketing strategies, and budget allocation—the decision to host the event aimed to address the pressing issue of homelessness in our community.
What was your decision-making style?
Analyze Decision-Making Style
We will analyze our decision-making style in this section of BUS 225 5-2 Discussion: Reflecting on Your Decision-Making Style.
- Reflect on your decision-making style during that particular scenario.
- Identify whether it was intuitive, rational, or based on recognition-primed decision-making.
Example
My decision-making style leaned towards a rational approach during the charity fundraiser event organization. I carefully analyzed available data, such as budget constraints, venue options, and potential fundraising strategies. Each decision was based on logical reasoning and objective evaluation of the available information. While intuition played a role in generating creative ideas, the overall approach prioritized rational analysis to ensure effective planning and execution of the event.
What went wrong?
Evaluate Outcome
Next, in BUS 225 5-2 Discussion: Reflecting on Your Decision-Making Style. We will evaluate the outcome of our decision-making.
- Consider what went wrong with the decision.
- Analyze factors such as insufficient information, biased judgments, or overlooking potential risks.
Example
Despite our rational decision-making approach, several challenges arose during the charity fundraiser event. One key issue was the underestimation of marketing efforts, leading to lower-than-expected attendance. Additionally, there was a lack of contingency planning for unexpected weather conditions, resulting in logistical complications. Furthermore, limited communication between committee members hindered the coordination of tasks, impacting the overall efficiency of the event. Reflecting on these shortcomings, it’s evident that better risk assessment and communication strategies could have mitigated these challenges.
What kind of plan would you suggest your peer put in place to prevent bad decisions in the future? Share the reasons for your suggestions.
Peer Response
Responding to peers is one of the vital parts of the BUS 225 5-2 Discussion: Reflecting on Your Decision-Making Style posts. We need to provide at least two peer responses. I will provide one example post. You can write your peer responses by keeping the following points in mind.
- Provide constructive feedback to at least two peers.
- Recommend strategies to prevent future bad decisions based on their experiences.
- Justify your suggestions with logical reasoning and insights.
Example
Considering your challenges in organizing the charity fundraiser event, I recommend implementing a comprehensive risk management plan for future initiatives. This plan should involve conducting thorough risk assessments at the project’s outset to identify potential pitfalls and develop contingency strategies. Fostering open communication channels among committee members can enhance coordination and problem-solving capabilities. Proactively addressing risks and improving communication can mitigate uncertainties and increase the likelihood of successful outcomes in future endeavors.
Closing
This How-To Guide allows you to understand the BUS 225 5-2 Discussion: Reflecting on Your Decision-Making
Style.
In the next module of BUS-225, we will explore the 6-1 Assignment on the Stakeholder Summary Report.
BUS 225 6-1 assignment: stakeholder summary report
Instructions for BUS 225 6-1 Assignment
Overview
Business reports often communicate an analysis of a scenario or aspect of a business in relation to a strategic goal or need. These types of reports can include the status of the organization, stakeholder summaries, market trends, and financial statements. The main goal of business reports is to help leaders in developing strategies and making decisions or recommendations for the improvement ofthe business. Additionally, business reports may also provide analysis of potential worst-case scenarios, solutions to issues currently faced by an organization, and a review of best practices and analogous situations faced by similar organizations.
Prompt
For this assignment, you will take on the role of a business manager who is in the planning phase of building a stakeholder summary report. You need an example from an organization in the same industry to get ideas and structure your report in the best way possible. You have identified the following report as a potential model:
- Estée Lauder 2020 Year in Review, Performance Highlight section
Review the report and think about what story it tells you based on the numbers and visualizations provided. Address the following questions in your post. Make sure to use evidence to support your responses.
Content
- How does the report use data?
- How does it use specific contexts, terms, and figures?
Presentation
- How does the overall look of the presentation appeal to readers?
- How does the report meet or not meet its objective?
Guidelines for Submission
Complete the Stakeholder Summary Report in your Soomo webtext, download your completed work, and submit it in Brightspace for instructor feedback. You should write using a professional voice, and any sources should be cited according to APA style. Your assignment must be between 400 and 800 words in length.
Introduction to BUS 225 6-1 Assignment
The BUS 225 6-1 assignment: stakeholder summary report revolves around your understanding of the Stakeholders Summary Report. I will provide brief and descriptive guidelines to solve the BUS 225 6-1 assignment: stakeholder summary report and a dummy solution for each section. This Owlisdom How-To Guide will equip you with guidelines to tackle all the queries related to this assignment. Let us begin with the guide.
Overview of Business Reports
To start the BUS 225 6-1 assignment: stakeholder summary report, we will analyse the given (2020)2020 report.
- Understand the purpose of business reports: to analyse scenarios, assess organisational status, summarise stakeholders, and provide insights for decision-making.
- Recognise that reports may include market trends, financial statements, worst-case scenarios, solutions to issues, and best practices.
Example
Analysing the (2020) report from Estée Lauder, it’s evident that business reports serve multiple purposes. They comprehensively analyse the company’s performance, including financial statements and market trends. Additionally, the report offers insights into stakeholder summaries and potential strategic decisions. By recognising the inclusion of various data points and analyses, we understand how business reports are valuable tools for assessing organisational status and informing decision-making processes.
Review the report and think about what story it tells you based on the numbers and visualisations provided. Address the following questions in your post. Make sure to use evidence to support your responses.
Analysing the Example Report (Estée Lauder 2020 Year in Review)
In this section of the BUS 225 6-1 assignment: stakeholder summary report, we will review the 2020 Report of Estée Lauder.
- Review the provided report from Estée Lauder’s investor page.
- Examine how data is utilised within the report to convey critical information and trends.
- Assess the use of specific contexts, terms, and figures to enhance understanding and relevance.
Example
Upon reviewing the Estée Lauder (2020) report, it becomes evident that data plays a crucial role in conveying critical information and trends. For instance, the report utilises specific figures and terms to highlight the company’s financial performance, such as revenue growth and contributions from hero franchises like Clinique’s Moisture Surge (2021). Visualisations, such as charts and graphs, further enhance understanding by presenting data in a visually appealing format. These elements collectively paint a story of the company’s achievements, challenges, and growth opportunities, providing stakeholders with valuable insights into Estée Lauder’s performance and prospects.
How does the report use data? How does it use specific contexts, terms, and figures?
Role and Assignment Context
Next, we will discuss the role and context of the BUS 225 6-1 assignment: stakeholder summary report.
- Assume the role of a business manager tasked with creating a stakeholder summary report.
- Identify a model report from the same industry to structure ideas effectively.
Example
The Estée Lauder (2020) report extensively uses data to provide insights into the company’s performance and market trends. Specific financial figures, such as revenue growth and contributions from critical franchises, are highlighted to showcase the company’s achievements. Moreover, the report employs terms and contexts relevant to the beauty industry, such as product launches and market dynamics, to enhance understanding. Estée Lauder effectively communicates its financial status and strategic direction to stakeholders by incorporating data-driven analysis and industry-specific terminology. As a business manager tasked with creating a stakeholder summary report, referencing this model report can help structure ideas effectively, ensuring that critical data points and industry-relevant terms are incorporated to convey a comprehensive overview of the organisation’s performance (Karpoff, 2021).
How does the overall look of the presentation appeal to readers?
How does the report meet or not meet its objective?
Evaluating Presentation
In the next section of the BUS 225 6-1 assignment: stakeholder summary report, we will discuss the presentation of the report.
- Evaluate the overall visual appeal of the report to readers.
- Determine whether the report effectively meets its objectives regarding clarity, completeness, and persuasiveness.
Example
The overall look of the Estée Lauder (2020) report is visually appealing, with a professional layout and clear formatting that enhances readability. Using charts, graphs, and images effectively breaks down complex data and adds visual interest to the presentation. However, while the report effectively communicates the company’s financial performance and critical achievements, it may fall short of providing comprehensive insights into potential challenges or areas for improvement. Additionally, the report’s objective to inform investors and stakeholders about Estée Lauder’s performance seems met, as it presents relevant data and analysis clearly and concisely. While the presentation is visually appealing and meets its primary objective, there may be room for improvement in providing a more holistic view of the company’s operations and future outlook.
Closing
This How-To Guide lets you understand the critical role of analysing stakeholders’ summary reports. Following the guidelines, you can solve the BUS 225 6-1 assignment: stakeholder summary report like a pro. Good luck!
In the next module of BUS-225, we will explore the 6-2 Discussion on Planning Your Presentation.
References
Karpoff, J. M. (2021). On a stakeholder model of corporate governance. Financial Management, 50(2), 321–343.
Lauder, E. (2020). Investors. https://www.elcompanies.com/en/investors
Suwitri, N. L. N., Santika, I. D. A. D. M., & Pratiwi, D. P. E. (2021). An analysis of semiotics was found in the selected skincare advertisement. Journal of Language and Applied Linguistics, 2(2), 217–227.
BUS 225 6-2 Discussion: Planning Your Presentation
Instructions for BUS 225 6-2 Discussion
Discussion
As you approach your Project Three submission for this course, it is important to think about your strategy for making your presentation to stakeholders. Your goal is to make the decision process easier and more efficient for those stakeholders.
Review the Planning a Presentation graphic from the HBR Guide to Persuasive Presentations and think about how you will address each aspect of the presentation-development process. In your initial post, focus on the conceiving and visualizing segments and address the following:
- How are you going to craft your story with your audience in mind?
- How are you going to illustrate your story and stay relevant?
In response to at least two of your peers, address the following:
- What suggestions can you make about your peers’ strategies for their presentations to help engage the stakeholders in the conversation? How would you suggest addressing questions, comments, and general feedback?
To complete this assignment, review the Discussion Rubric.
Introduction to BUS 225 6-2 Discussion
BUS 225 6-2 Discussion: Planning Your Presentation involves preparing a persuasive presentation aimed at simplifying the decision-making process for stakeholders. This Owlisdom How-To Guide will help you develop a structured approach to conceiving and visualising your presentation, leveraging strategies from the HBR Guide to Persuasive Presentations. The focus is on creating a compelling narrative and using effective visuals that resonate with your audience.
Identifying the Main Message
To start the BUS 225 6-2 Discussion: Planning Your Presentation, we will first discuss what defining the presentation objective and focusing on key points is important.
- Define Your Objective: Clearly state what you hope to achieve with your presentation.
- Focus on Key Points: Limit your message to a few core ideas that support your objective.
Example
When identifying the main message of our presentation, it’s crucial first to define our objective clearly. Think about what we really want to achieve with this presentation. Are we trying to persuade stakeholders to invest, to approve a project, or simply to inform them of progress? Once we’ve pinned that down, focusing on key points becomes much easier. We should distil our content into a few core ideas that directly support our objective. This means if our goal is to persuade investment, our key points should revolve around potential profitability, market demand, and competitive advantage. By keeping our message focused and aligned with our objectives, we make it more digestible and impactful for our audience.
How are you going to craft your story with your audience in mind?
Structuring the Presentation
Next, in BUS 225 6-2 Discussion: Planning Your Presentation. We will discuss how to structure the presentation to make it engaging properly.
- Introduction: Set the stage with a strong opening that captures attention.
- Body: Build your argument sequentially, ensuring each point logically follows from the last.
- Conclusion: Summarize the main points and restate your objective persuasively.
Example
Building on our discussion about focusing our presentation, let’s talk about structuring it in a way that truly engages our audience. We need to start with a strong introduction that grabs their attention right off the bat—maybe a startling statistic, a compelling question, or a relevant story that sets the tone for our narrative. For the body of the presentation, it’s important to ensure that each point flows logically into the next. This not only helps keep the audience engaged but also builds a strong case for our objective. Finally, the conclusion should neatly wrap up our presentation by summarising the key points and restating our main objective in a powerful way to leave a lasting impression. This cohesive structure will help keep our audience focused and responsive to our message.
How are you going to illustrate your story and stay relevant?
Visualising Your Story
In this section of the BUS 225 6-2 Discussion: Planning Your Presentation, we will discuss how to add relevant visuals to the presentation to make it more interesting and engaging.
- Select Appropriate Tools: Choose graphs, images, or videos that enhance understanding.
- Simplicity is Key: Avoid cluttering visuals with too much information.
- Align Visuals with Your Message: Each visual should reinforce your narrative.
- Update Content: Ensure all data and references are current and applicable.
Example
As we integrate visuals into our presentation, selecting the right tools is essential. Graphs, images, and videos can significantly enhance understanding if they’re chosen wisely. It’s crucial to keep these visuals simple to avoid overwhelming our audience with too much information. Each visual should directly support and reinforce our narrative, ensuring that every slide or video clip we use is tightly aligned with the points we’re making. Also, we must keep our data and references up to date to maintain relevance and credibility in our presentation.
What suggestions can you make about your peers’ strategies for their presentations to help engage the stakeholders in the conversation? How would you suggest addressing questions, comments, and general feedback?
Peer Responses
Responding to peers is one of the vital parts of the BUS 225 6-2 Discussion: Planning Your Presentation posts. We need to provide at least two peer responses. I will provide one example post. You can write your peer responses by keeping the below points in mind.
- Respond to at least two peers by considering their presentation strategies.
- Offer constructive feedback focused on enhancing engagement with stakeholders and effectively managing questions and feedback.
Response 01
Hey Sam, nice post! I think your approach to crafting the presentation is solid, and focusing on clarity and relevance is key. One suggestion to further engage stakeholders might be to include interactive elements or real-time polls during the presentation. This could foster interactive dialogue and make the session more engaging. Additionally, when addressing questions, comments, or feedback, it could be beneficial to prepare a few anticipated Q&As in advance. This preparation helps ensure you handle inquiries smoothly and maintain control of the presentation narrative. Great job laying out a clear and structured approach!
Response 02
We are supposed to write two peer responses. I have addressed the given instructions in one response. Following these instructions, you can quickly write your peer responses to BUS 225 6-2 Discussion: Planning Your Presentation without a hassle.
Closing
The success of your presentation hinges on how well you understand your audience and tailor your message to their needs. By following this How-To Guide of BUS 225 6-2 Discussion: Planning Your Presentation, you can craft a clear, compelling story and support it with well-designed visuals; you can facilitate a smoother decision-making process for stakeholders. Remember, the goal is to communicate, not just present information.
In the next module of BUS-225, we will explore the 7 Project Three Guidelines and Rubric.
BUS 225 7-1 project three submission
Instructions for BUS 225 7-1 project three submission
Scenario
Your presentation to the leadership panel of your company was well-received. Now you must create a presentation for a wider audience—stakeholders from inside and outside the company—and include your decisions and recommendations, which were approved by the leadership panel. Remember that your presentation must convey professionalism and be visually appealing as well as informative.
Directions
Create a presentation of your research and data findings from Project Two, including your decision and rationale.
- Construct a professional business presentation for internal and external stakeholders.
- Identify your key message to both internal and external stakeholders.
- Illustrate your key points using visualizations.
- Tell your story.
Specifically include the following in your presentation:
- Communicate your decision about diversification based on your analysis of the data and research.
- Use visualizations to tell the story of the (quantitative and qualitative) data.
- Determine the likelihood of success based on the data and research collected.
- Discuss the impact that moving to the new industry will have on the organization and its internal and external stakeholders.
- Detail your recommendations for moving forward.
- Summarize the findings of the research performed.
- Include research conclusions and reasoning.
- Describe the rationale behind your recommendations.
What to Submit
To complete this project, you must submit a PowerPoint presentation of 10 to 15 slides, including speaker notes. Sources should be cited according to APA style.
Introduction to Module 7 Project Three
The BUS 225 7-1 project three submission involves crafting a polished business presentation for internal and external stakeholders. The presentation will encapsulate the findings and decisions from previous research projects, mainly focusing on diversification strategies. The goal is to effectively communicate complex data and strategic decisions, ensuring clarity, professionalism, and engagement from varied audiences.
You must use the data you generated in Module Three, Project One, and Module Five, Project Two.
1. Construct a professional business presentation for internal and external stakeholders.
- Identify your key message to both internal and external stakeholders.
- Illustrate your key points using visualizations.
- Tell your story.
Understanding the Audience
We will first identify our key stakeholders to start the BUS 225 7-1 project three submission. We will give a brief overview of our project in a short paragraph.
- Internal Stakeholders: Focus on how the decisions will impact their roles, responsibilities, and future operations within the company. Your message should be reassuring and detail-oriented, highlighting benefits and addressing potential concerns.
- External Stakeholders: Emphasize the broader impact on the industry, potential market growth, and how the decision aligns with market trends. Ensure the tone is confident and forward-looking, suitable for investors, partners, and industry analysts.
- Data Visualization: Evident, visually appealing charts and graphs represent quantitative data such as market trends, financial forecasts, and consumer behavior analytics.
- Narrative Construction: Tell a coherent story from the beginning of the research to the final decisions. Link each presentation part logically to keep the audience engaged and informed.
2. Communicate your decision about diversification based on your analysis of the data and research.
- Use visualizations to tell the story of the (quantitative and qualitative) data.
- Determine the likelihood of success based on the data and research collected.
- Discuss the impact moving to the new industry will have on the organization and its internal and external stakeholders.
Detailing the Decision on Diversification
Next, in BUS 225 7-1 project three submission. We will discuss the diversification and decisions made by analyzing the data and research.
- Visual Storytelling with Data: Use comparative graphs to show before and after scenarios or market conditions. This helps illustrate the ‘why’ behind diversification.
- Success Likelihood Analysis: Present data analytics that model potential outcomes of the diversification. Use predictive analytics if available, and discuss confidence levels or uncertainties.
- Stakeholder Impact Discussion: Discuss how the diversification will affect various stakeholder groups. Use scenario analysis to depict potential impacts, helping stakeholders visualize the change.
3. Detail your recommendations for moving forward.
- Summarize the findings of the research performed.
- Include research conclusions and reasoning.
- Describe the rationale behind your recommendations.
Formulating Recommendations
We will formulate recommendations based on our data analysis and research for the last section of the BUS 225 7-1 project three submission.
- Research Summary: Concisely summarize the key findings from the data analyzed. Focus on those findings that directly support your recommendations.
- Conclusion and Reasoning: Clearly state the logical reasoning that connects your data findings to the proposed recommendations. This section should underscore the thought process behind the strategic choices.
- Recommendation Rationale: Describe why these recommendations were chosen over others, focusing on their benefits to the organization and internal and external stakeholders.
Closing
The BUS 225 Project Three encapsulates the critical task of translating complex data and research into actionable strategic decisions communicated effectively to a diverse audience. This exercise not only enhances your problem-solving and decision-making skills but also hones your ability to convey information in a professional, accessible manner. As future business leaders, mastering these skills will prove invaluable in your career, equipping you to handle complex business scenarios with confidence and clarity. You can also read BUS-225 complete modules to ace the course!
Presentation Example
Speaker’s Notes
Slide 1 is the Title Slide.
Slide 2: The automotive sector plays a significant role in the U.S. economy. As competition intensifies, companies need to adapt their strategies to meet the continuously changing preferences of consumers. The pandemic has reshaped travel behaviors, changing how car manufacturers market their products. These firms must branch into emerging markets to sustain their competitive edge and increase shareholder value. Moreover, the increasing focus on hybrid and electric vehicles transforms industry standards, compelling the sector to innovate and evolve (Iyer, 2022).
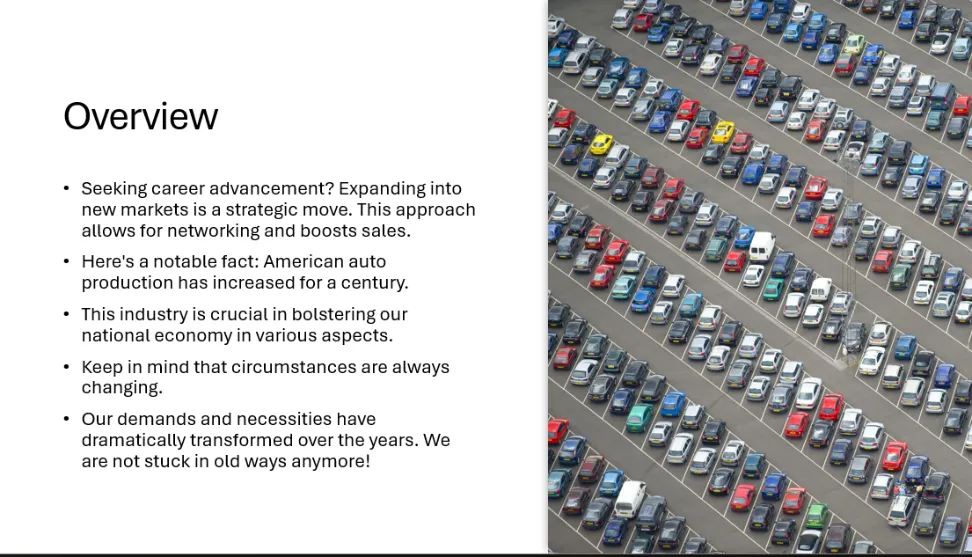
Slide 3: Historically, the automotive industry saw minimal returns on investment in research and development, which meant that despite their significant impact on global warming, automakers invested sparingly in R&D. However, this trend has significantly shifted, with industry leaders like Toyota and GM boosting their R&D expenditures from 16% to 30%, prompting their rivals to follow suit. This increase in investment has particularly enhanced electric vehicle (EV) production, with a new emphasis on creating autonomous vehicles (Llopis-Albert et al., 2021).

Slide 4: Technology companies are increasingly equipped to offer continuous and flawless services to their customers, significantly impacting other sectors striving for exceptional customer service. Machine learning has become a pivotal technology that enables smooth interactions between businesses and their clients amid rapid technological advancements. Machine learning enhances service quality by mimicking human behaviors using algorithms and data. This advancement allows machines to replicate human interactions, offering a customer experience comparable to human agents. Consequently, consumers enjoy superior services, transforming business operations and executing tasks (Upadhyay et al., 2020).
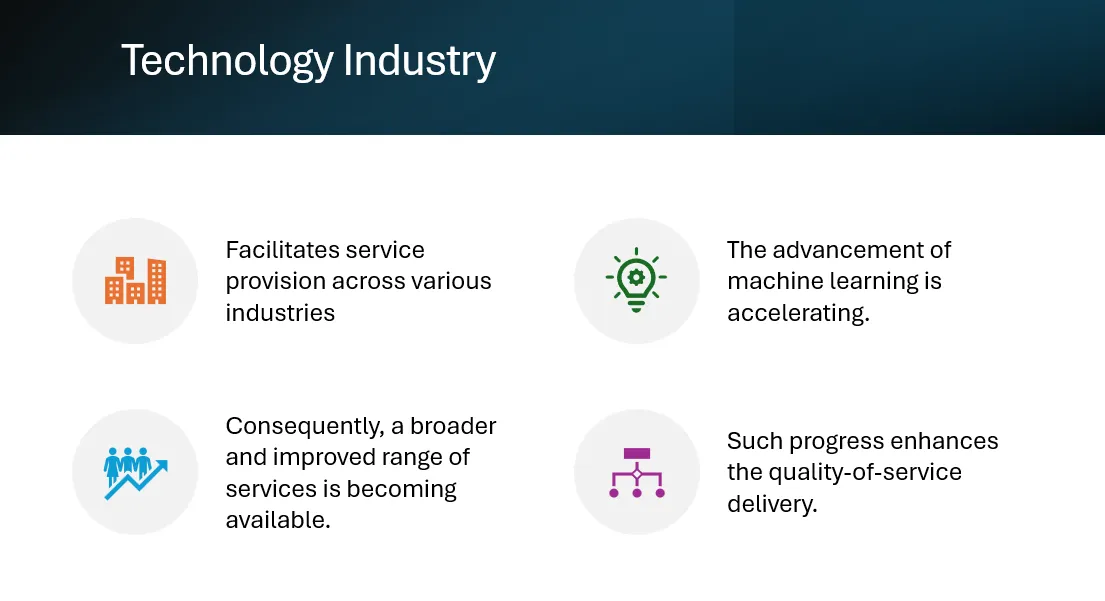
Slide 5: The BUS 225 Module 7 Project 3 focuses on understanding the vital roles of internal stakeholders in an industry. Numerous insiders play a significant role in the automotive industry’s success, with the United States frequently viewed as a leading force globally. Most stakeholders in the automobile sector are internal, encompassing owners, managers, and employees. The responsibilities and expectations of each internal stakeholder must be explicitly outlined. For example, corporate investors are expected to invest sufficiently to guarantee the company’s smooth operation.

Slide 6: The automobile industry must maintain strong relationships with suppliers and customers, as competition drives innovation and distinctive offerings. Government regulations also significantly influence the industry. To effectively manage these relationships, the industry needs a robust communication strategy that clarifies organizational goals and enhances stakeholder understanding (Lechler et al., 2020).

Slide 7: In BUS 225 Project Two, the focus is on applying quantitative data methods to study the automobile industry, particularly to understand consumer preferences, market size, and demographics. Automakers can leverage this data to make informed decisions that will drive business strategies. The methodologies used to derive quantitative data from gathered information have proven to be effective. For example, by analyzing the mean values of the data, t-tests can be employed to determine whether two data sets originate from the same sample or population. While t-tests are valuable for comparing two groups, additional testing is often necessary when dealing with more variables and larger sample sizes, allowing for a more comprehensive analysis.

Slide 8: Qualitative data is crucial in the automotive industry for uncovering valuable insights through engaging and open-ended conversations. Techniques like in-depth interviews, focus groups, and surveys enable car manufacturers to understand better how consumers perceive competing brands. These methods facilitate accurate data collection for research, enhancing knowledge about the automotive industry’s offerings. Detailed interviews with representatives from diverse automakers can provide extensive direct information about their products. Although observational research has its constraints, it remains a valuable tool for examining companies and identifying modifications in their production.
Slide 9:
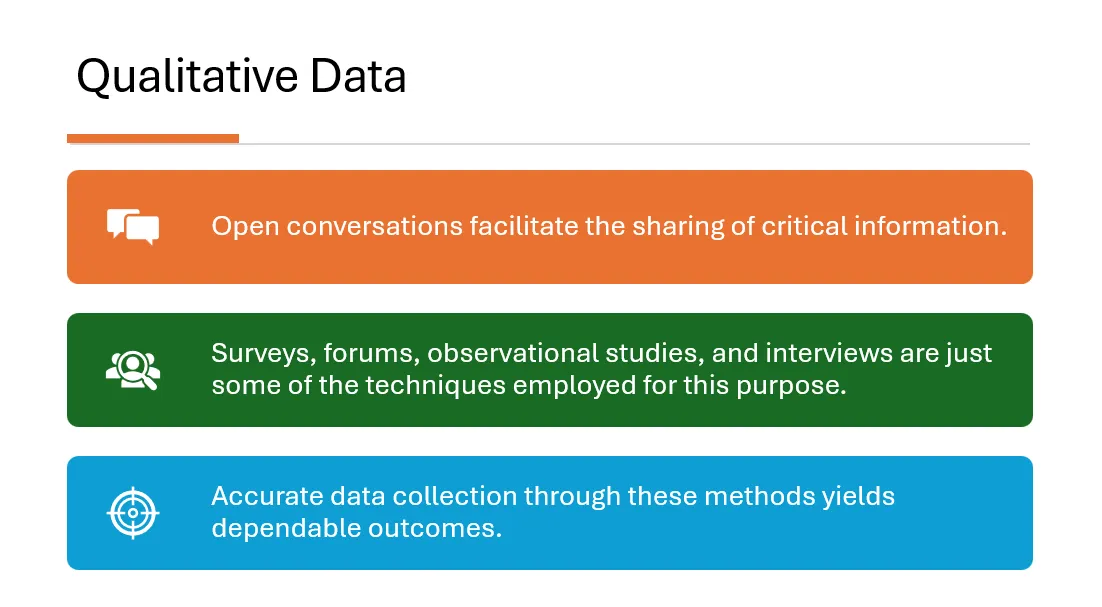
Entering a new market presents multiple challenges for a business, potentially necessitating a comprehensive organizational overhaul that could impact numerous employees. This change could lead to various employee outcomes, from job losses and salary reductions to diminished benefits. Such a transition could profoundly influence the company’s internal and external stakeholders. Internal stakeholders, including employees, might experience salary reductions or job eliminations. Externally, consumer discontent with the offerings of the new industry could lead to a decrease in sales, affecting the business’s performance (Anon, 2020).
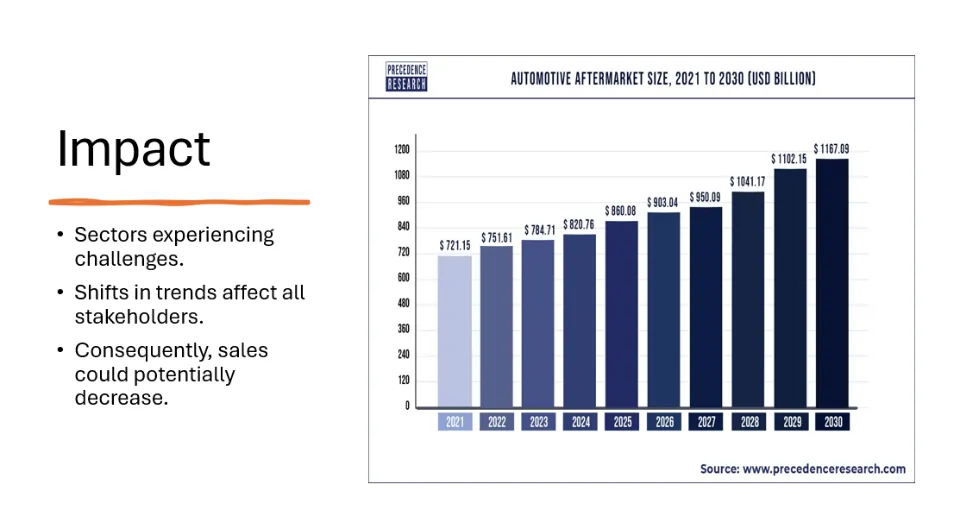
Slide 10: The study emphasizes the essential roles of internal and external stakeholders in the automobile industry. Given the intense competition in today’s market, all participants must exert significant effort to sustain operations. Moreover, integrating quantitative and qualitative data analysis is vital to this research, offering distinct and critical insights into the American automobile industry. Data indicates that a company’s venture into a new market impacts the involved parties. New management practices and objectives might lead some stakeholders to steer clear of the new sectors (Mathivathanan et al., 2018).
Slide 11: In BUS 225 Module 3 Project One, the focus is on identifying opportunities for growth and expansion. As technological progress in the tech sector continues to accelerate, there are substantial opportunities for revenue expansion through diversification into the industry. The ongoing advancement of technology enhances both the accuracy of customer service and the smoothness of the user experience. Meanwhile, the automobile industry is slowly recovering from the impacts of the pandemic. Consequently, the focus is shifting towards electric vehicles as the industry moves away from fossil fuels and towards electric power. Numerous manufacturers producing electric and traditional gas vehicles have embraced this shift. Therefore, pivoting towards the IT sector is deemed essential for future success.

Slide 12: The technology and automotive manufacturing industries have many parallels and differences. For example, competition among companies stems from their comparable scale and scope. Both sectors demand substantial upfront investments to rival the large, established entities. A key difference lies in the challenge of substitute products. Substitutes are a significant threat in the technology sector due to similar products’ wide availability and popularity. In contrast, the automotive sector faces less threat from substitutes, as few alternatives match the quality and convenience offered by established automotive products.

Slide 13: The offerings of IT companies are adapting due to escalating customer expectations within the technology sector. Consumers seek solutions to consolidate their online interactions through a single dashboard or device as the digital environment becomes more segmented. They are eager to streamline processes, safeguard personal data, and reduce expenses in areas such as insurance through automation of mundane data tasks, all of which are steering the course of the digital industry. Ensuring efficient operations, for example, necessitates automating processes utilizing big data.
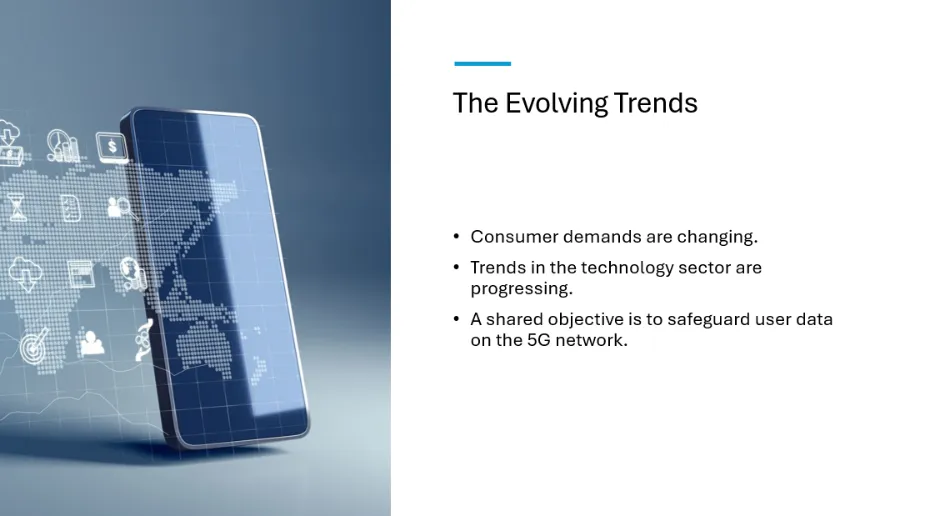
Slide 14: In BUS 225 Project 3, the presentation details tactics for the automobile industry to stay competitive in today’s market. Technologies like the Internet of Things can connect companies to their supply chains, enabling employees and inspectors to access critical information remotely, regardless of their proximity to the company. Fostering strong relationships with suppliers may improve component quality and enhance comprehension of internal operations, facilitating the fulfillment of customer requirements. Staying current with industry trends is crucial to prevent lagging behind competitors and to remain informed about advancements in the sector.

Slide 15: Achieving organizational success through diversification is costly and demands significant commitment, making it crucial to reduce the risk of failure. The company can then concentrate on the elements that influence the ecosystem and make well-informed choices regarding investment timing, amount, and location. While extensive data is available on the IT industry, there remain market gaps that other sectors, such as the automotive industry, can exploit.

Slide 16: The two industries can work together to enhance their service efficiencies. Each sector is poised for further growth, which will aid its long-term sustainability. The technology sector is growing, and the automotive manufacturing industry has improved post-Covid-19. With escalating competition and evolving consumer preferences, both industries have been compelled to improve their products and services. Collaborative efforts are essential for both sectors to keep growing and stay competitive. Such cooperation will contribute to sustaining equilibrium within the industry.